When consumers pay their electricity bills each month, they probably don't give it much thought. While many probably expect to see higher bills when the heat or air conditioning have to run, they may not realize how much variance there is between states in the cost of electricity.
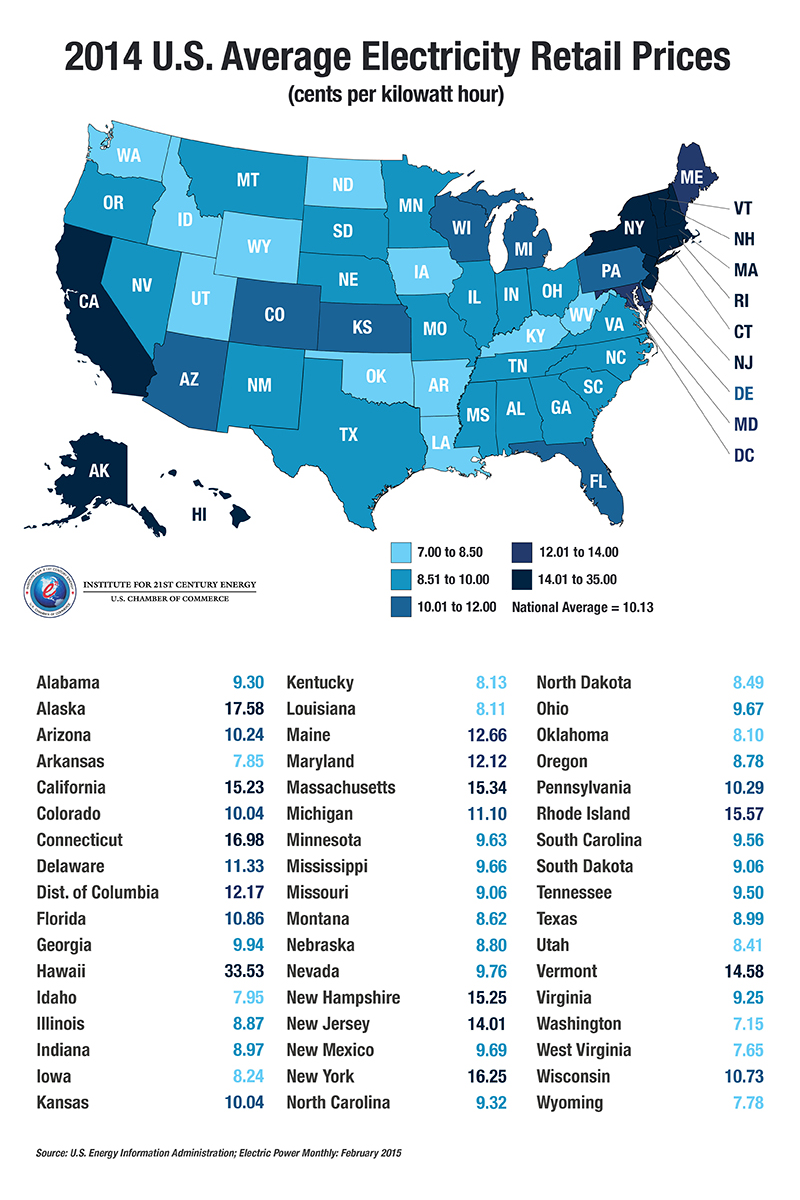
Each year, the Institute for 21st Century Energy analyzes electricity prices around the nation and creates a map showing the wide variances. We rely upon information from the Energy Information Administration from the prior calendar year. While retail electricity prices typically do not vary significantly from year to year, trends are noticeable when prior years are compared. In 2014, which is the most recent year with full price data, every single state, except for Michigan, saw its electric rates increase. So, if you thought that your electric bills were a bit higher last year, you were right. Unfortunately, with the federal government on a march to impose costly new regulations on the power sector, this trend is likely to continue for many years to come.
Besides bringing greater understanding to consumers, our map helps demonstrate how certain policies drive prices. Let's dig a little deeper.
Not surprisingly, Hawaii again owns the dubious title of having the most expensive electric rates in the country. Alaska comes in behind the Aloha State at second highest. Given their unique geographic circumstances and complete isolation from the diverse sources of electricity that exist across the balance of the country, that's understandable and doesn't tell us much from a policy perspective.
However, the lesson begins with the next two states on the list, Connecticut and New York, which both impose more than 16 cent-per-kilowatt-hour electric prices upon their residents. For comparison sake, these prices are more than double the rates enjoyed by the seven least expensive states. The balance of New England, along with New Jersey and California, round out the nine most expensive states in the lower forty-eight.
What do these states share in common?
For one, each of these states has turned its back on one of our most reliable and affordable sources of electricity: coal. While the nation on average obtains 37% of its electricity from coal, the biggest coal user among this group is Massachusetts, at a mere 8.8% of electricity production.
Second, every one of these states either is, or has recently been part of, a carbon cap-and-trade scheme such as theRegional Greenhouse Gas Initiative (RGGI) or California AB32. Despite what proponents of these policies might say, these initiatives clearly drive electricity prices higher.
On the other side of the coin, the ten lowest-priced states enjoy low rates predominately due to their use of coal to generate electricity. Seven of the lowest-priced states (West Virginia, Wyoming, Arkansas, Oklahoma, Kentucky, Iowa, and Utah) rely on coal more than any other resource, using it for between 40% and 95% of their electric power. Two of the remaining lowest-priced states (Washington and Idaho) are gifted with plentiful hydroelectric resources which result from unique geographic circumstances in those states.
While many states are speaking out against the EPA's plan to impose its own version of cap-and-trade across the country, the few states vocally supportive of the EPA's efforts would appear to fall into the "misery loves company"camp. We can certainly understand why these high-price states may see a benefit to driving prices up for everyone else. Nevertheless, for the sake of consumers and economic growth, both the federal government and states should pay close attention to what has happened to electricity prices in states that have chosen more stringent regulations. And at the very least, consumers should realize that they will be the ones paying for those choices.