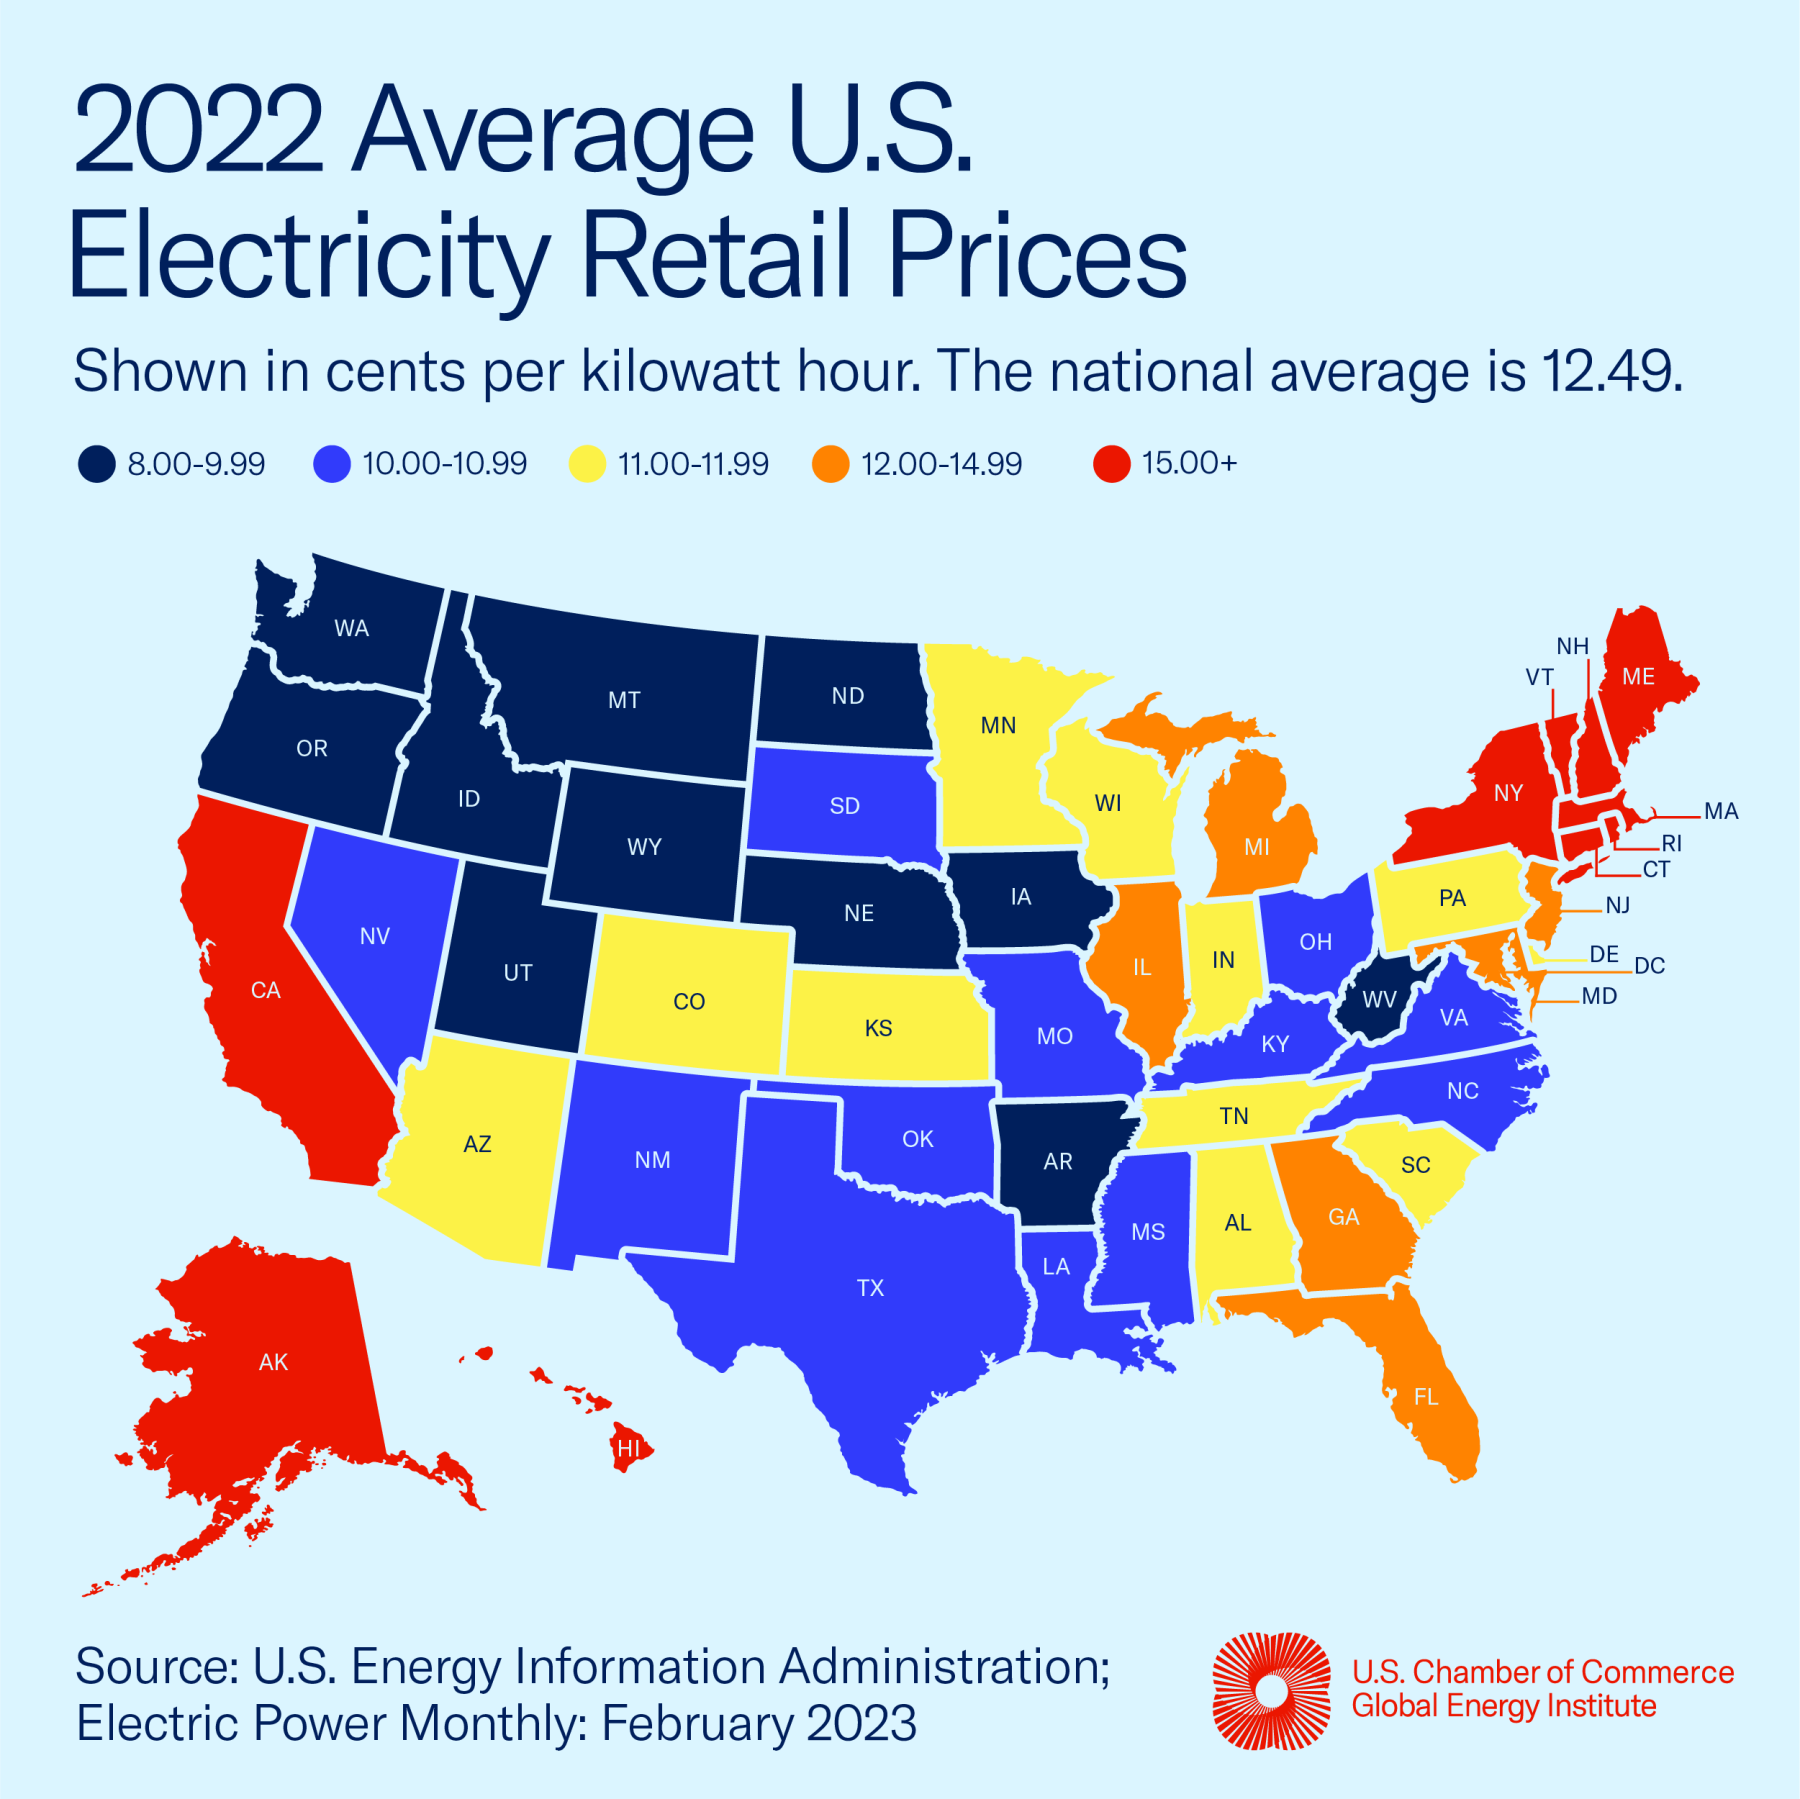
2022 U.S. Average Electricity Retail Prices
Above is the latest version of our annual U.S. electricity price map. Using the most recent full year of data available from the U.S. Energy Information Administration, our map gives insight into what electricity costs across the country. As always, the map shows that there are stark differences from state to state. While the energy mix available within a state will play a large role in state electricity prices, energy-limiting policies in some states act to artificially elevate prices, making the price of electricity much higher for consumers and businesses. See where your state ranks, and compare it to the national average below.
Click here for a printable version of the map. And see the maps from previous years: 2013, 2014, 2015, 2016, 2017, 2018, 2019, 2020 and 2021.

