The Environmental Protection Agency (EPA) recently released its Inventory of U.S. Greenhouse Gas Emissions and Sinks covering the years 1990 to 2018. Among other things it shows that carbon dioxide emissions from fuel combustion in 2018 were 12.3% lower than in 2005, a record that compares very favorably with other advanced economies in Europe and elsewhere.
It has been widely noted that the economic slowdown accompanying the global coronavirus pandemic will result in unprecedented drops in greenhouse gas emissions here and across the globe—estimates of 15% to 20% are not out of the question. We won’t know how much until official figures are released, which in the U.S could take several months, as there is a lag in the availability of data. In the meantime, EPA’s Inventory gives us a good indication of the trends that were occurring and helps us track progress toward emissions reductions.
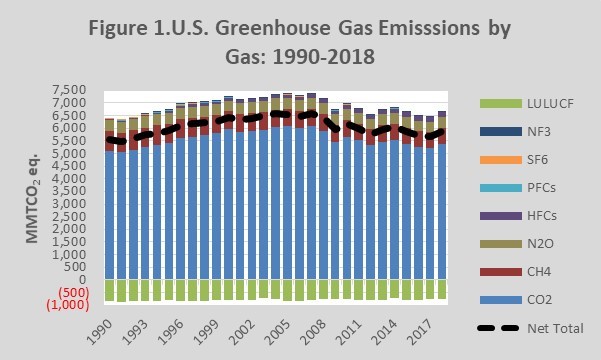
The latest inventory includes data on carbon dioxide (the largest source of GHGs), methane, nitrous oxide, hydrofluorocarbons, perfluorocarbons, sulfur hexafluoride, and nitrogen trifluoride. It also includes estimates for how much atmospheric carbon dioxide is absorbed by “sinks,” primarily by forests and vegetation. While in the United States emissions from Land Use, Land Use Change, and Forestry (LULUCF) are negative, in many countries, LULUCF is a source of carbon dioxide emissions, not an emissions sink. The data produced by the EPA are submitted to the UN Framework Convention on Climate Change.
In total, net emissions of all GHGs in the United States (excluding U.S. territories) increased by 3% in 2018. Despite the recent uptick, emissions in 2018 were 10.3% below the 2005 level, when U.S. emissions were at their peak. Figure 1 shows the emission trends for each of the GHGs and includes a line showing the trend in “net” emissions that include the “negative” emissions from LULUCF.
Energy-Related Carbon Dioxide Emissions
Our interest is primarily in emissions from energy consumption, which account for three-quarters of total gross GHG emissions. So let’s take a look at the data for energy-related emissions in five sectors: electric power, transportation, industrial, residential, and commercial.
The data in Figure 2 shows emissions data for these five sectors. While 2018 energy-related emissions were 3% above the 2017 level, they were (12.4%) below the 2007 peak level and equivalent to emission levels in the mid-1990s. All sectors saw increased emissions, especially the residential sector, which saw its emissions jump nearly 15% (though emissions in this sector are still at about their 1990 level).
More than 90% of that total decline in energy–related emissions since 2007 occurred in the power sector. Greater use of natural gas, regulations targeting coal, tax credits for renewables, and continued improvements in electricity intensity—i.e., the amount of electricity needed to produce a dollar of GDP—all contributed to the decline in power sector emissions. In fact, power sector emissions in 2018 were at their 2nd lowest level recorded by the EPA going back to 1990 (only emissions in 2017 were lower).
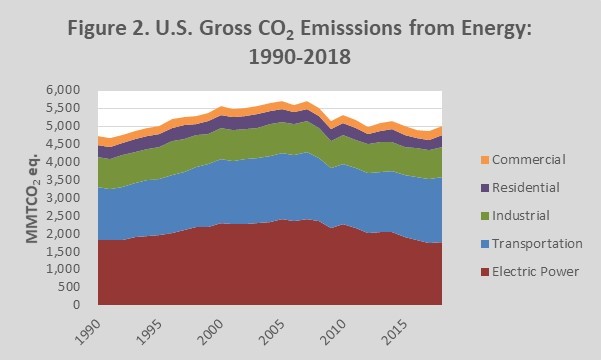
Indeed, since 2016, emissions from the transportation sector overtook the power sector as the largest source of CO2 emissions from energy. Emissions from this sector have been increasing in recent years because of affordable fuel and a continued consumer preference for SUVs and pick-up trucks. The Energy Information Administration’s (EIA) latest forecast, however, suggests a downward trend in emissions from this sector, and of course that forecast was done before the coronavirus pandemic. How the fluctuations in oil and automobile markets play out among businesses and consumers is a guessing game at best.
Residential and commercial emissions have recently seen a slight increase. Over the long term, however, there has been no discernible tends in emissions for either of these sectors. Both have become much more efficient, yet, in the residential sector in particular, consumer shifts toward larger homes, more electronic devices, and warmer climates have increased energy use, offsetting efficiency gains. Industrial emissions also have increased modestly in the last few years, but the economic impact from the coronavirus pandemic has made it difficult to predict what the future may hold.
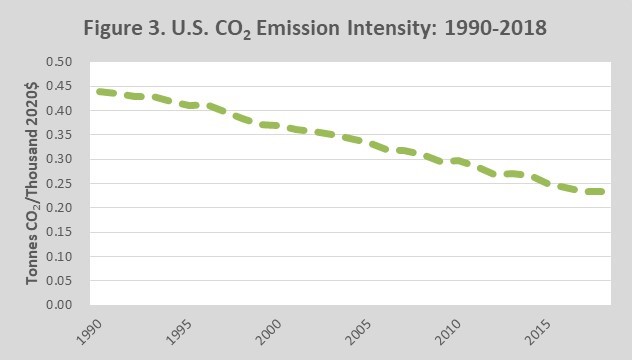
The amount of CO2 emitted per dollar of GDP produced, known as emissions intensity, has dropped steadily. In 2018, the emissions intensity of the U.S. economy was 30% lower than it was in 2005 (Figure 3).
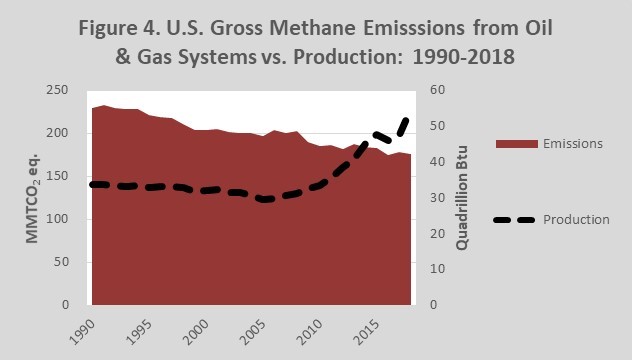
Another positive has been the decline in methane emissions from oil and natural gas systems—the series of pipelines, valves, tanks, compressors, and other things that make production of these fuels possible. Figure 4 illustrates the trends in methane emission from oil and gas systems from EPA’s inventory and domestic production of oil and natural gas from EIA.
Since 1990 there has been a steady decline in methane emissions from these systems—a trend that has persisted since the steep rise in oil and gas production from shale formations (black line). Not only were methane emissions per Btu of oil and gas produced declining, they’ve been declining in absolute terms, as well. Again, the pandemic has made any guess about the future of this sector challenging, but we will continue to share the most up-to-date data available.