Readers of Fuel for Thought are very familiar with the Chamber (and the broader business community’s) ongoing efforts to build consensus and advance effective climate policy solutions. We’ve made no bones about the fact that technology and innovation are not just an underappreciated solution to the climate challenge; they are arguably the most important factor that will determine how quickly and at what cost we can meet climate goals.
To this end, we were proud to be a leading voice behind the enactment of the Energy Act of 2020, and we continue to focus on this issue as we turn to secure funding for the legislation and highlight its importance through our new EnergyInnovates webinar series.
With that background, as we settle in to 2021, its worth taking a closer look at some of the real-world trends and circumstances that help shape our priorities and focus on this topic. In this context, we emphasize “world” as it is necessary to recognize that climate is a global challenge requiring both U.S. leadership and global solutions.
As such, consider the following seven “Numbers to Know,” which collectively illustrate how and why technology solutions aren’t just a “nice to have” aspect of climate policy—they are an imperative.
1) 50 PERCENT
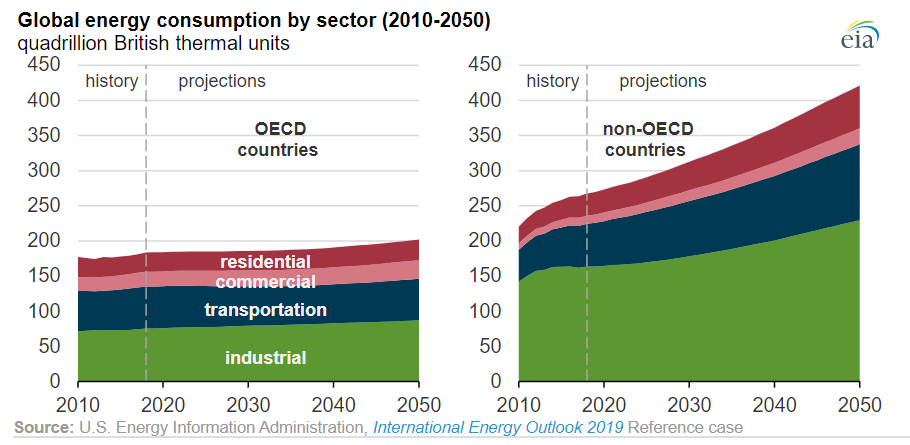
This is the EIA’s forecast for growth in global energy consumption between 2018 and 2050. This increase is a somewhat less than the 63% growth that occurred between 1990 and 2019, but the story remains the same: the world is hungry for energy, and that is unlikely to change. Moreover, as EIA’s chart below shows, nearly all of this demand growth will come from developing (non-OECD) countries seeking to expand energy access and raise their standard of living. The key, therefore, will be meeting that demand growth with low carbon energy sources; and the key to that is catalyzing the innovation to make clean energy the most affordable option for these countries.
2) 7.8 GIGATONS
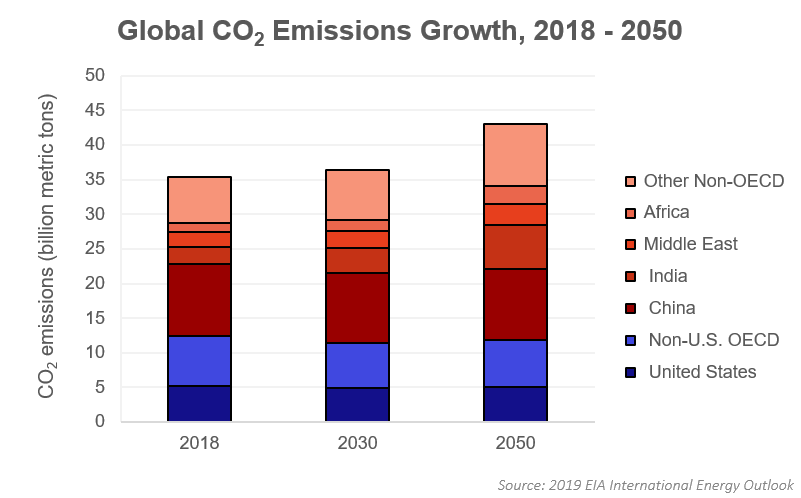
This is the amount of global CO2 emissions growth projected between 2018 and 2050, according to the most recent Energy Information Administration international forecast. As is the case with energy demand, nearly all emissions growth is expected to come from developing countries. The good news is that the projected 50% increase in global energy demand translates to just 22% emissions growth, thanks to rapid projected deployment of renewables and other low carbon sources. Nonetheless, 7.8 gigatons is nearly 1.5 times larger than economy-wide CO2 emissions in the U.S.—a very large increase in a world that is trying to reverse course.
3) 503 GIGAWATTS
This is the amount of coal plant capacity around the world that is currently either under construction (323 GW) or being planned (179 GW), according to the site Global Energy Monitor. Nearly half of this total (247 GW) is located in China, raising questions about its commitment to achieve its net zero emissions goal by 2060.
Meanwhile, another 858 gigawatts of coal plant capacity has initiated operations around the world since 2010. For perspective, this is nearly four times the current U.S. coal fleet of approximately 220 GW. Moreover, because new plants are typically built on a depreciation schedule of 30-40 years or more, many would be expected to remain operational past midcentury, particularly in developing countries less capable of absorbing financial losses associated with premature closure.
The massive scale and expected operational lifetime of these plants is a key reason why technological progress to reduce the cost of carbon capture utilization and sequestration (CCUS) is so important. Under a carbon-constrained 1.5-degree scenario, Wood Mackenzie estimates that 8 gigatons of CO2 could be captured and removed from the power and industrial sectors. These statistics make the technology imperative abundantly clear. Fortunately, the Energy Act of 2020 authorizes up to six major demonstration projects to begin to prove and ultimately deploy promising CCUS technologies. The Chamber will be hosting an EnergyInnovates series discussion featuring Senators John Barrasso and Sheldon Whitehouse and other experts on this very topic next week.
4) 715 MILLION METRIC TONS
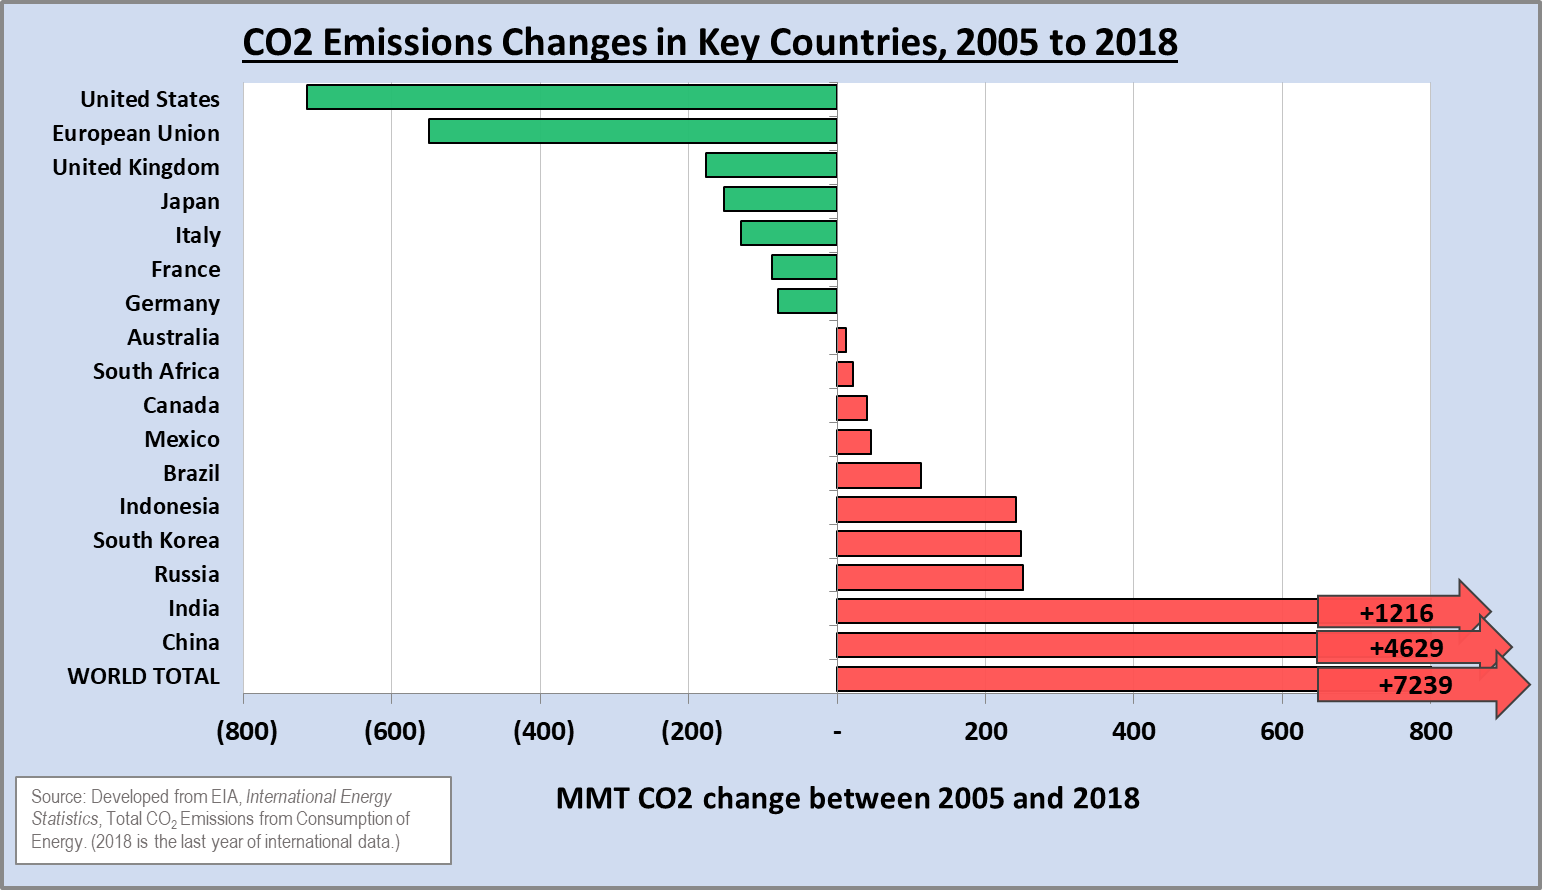
This is the amount of annual CO2 emission reductions in the United States between 2005 and 2018. As we detailed in a recent blog, this progress—powered by a combination of the shale gas revolution and steady growth in renewable energy generation—represents an amount far greater than that ever achieved by any other country. (Note: on a percentage basis, reductions in the EU during this time period are slightly greater than the United States.)
The chart below illustrates this progress relative to the rest of the world. Here again, trends are uneven, owing largely to the aforementioned disparities between the developed and developing world. In fact, for every ton of CO2 reduced in the United States since 2005, the rest of the world has increased emissions by more than 10 tons, led of course by China and India.
5) 770 MILLION
This is the number of people in the world living without access to electricity, according to IEA. About 75 percent, or 590 million, of these people live in sub-Saharan Africa, while others are dispersed throughout the developing world. On the bright side, admirable progress is being made to address this problem. In 2000, only 73 percent of the world had electricity access. Today, that figure is 90 percent, thanks to almost 1.2 billion people gaining access in Asia during that time period.
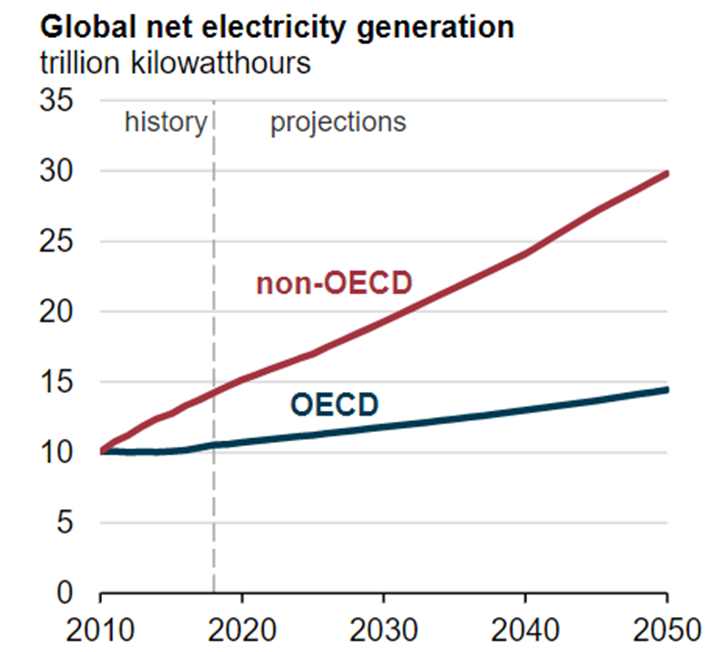
It’s important to note, however, that the definition of electricity access is a low bar, defined as a minimum of 250 kilowatt hours (kWh) per year for rural households and 500 kWh for urban households. According to IEA, this level of consumption could provide for “the use of a floor fan, a mobile telephone and two compact fluorescent light bulbs for about five hours per day.” By comparison, the average U.S. household uses about 11,000 kWh per year. It is therefore no surprise that EIA is forecasting electricity demand in non-OECD countries to more than double between 2018 and 2050 (see chart), as developing countries continue to focus on poverty reduction.
6) 14 PERCENT
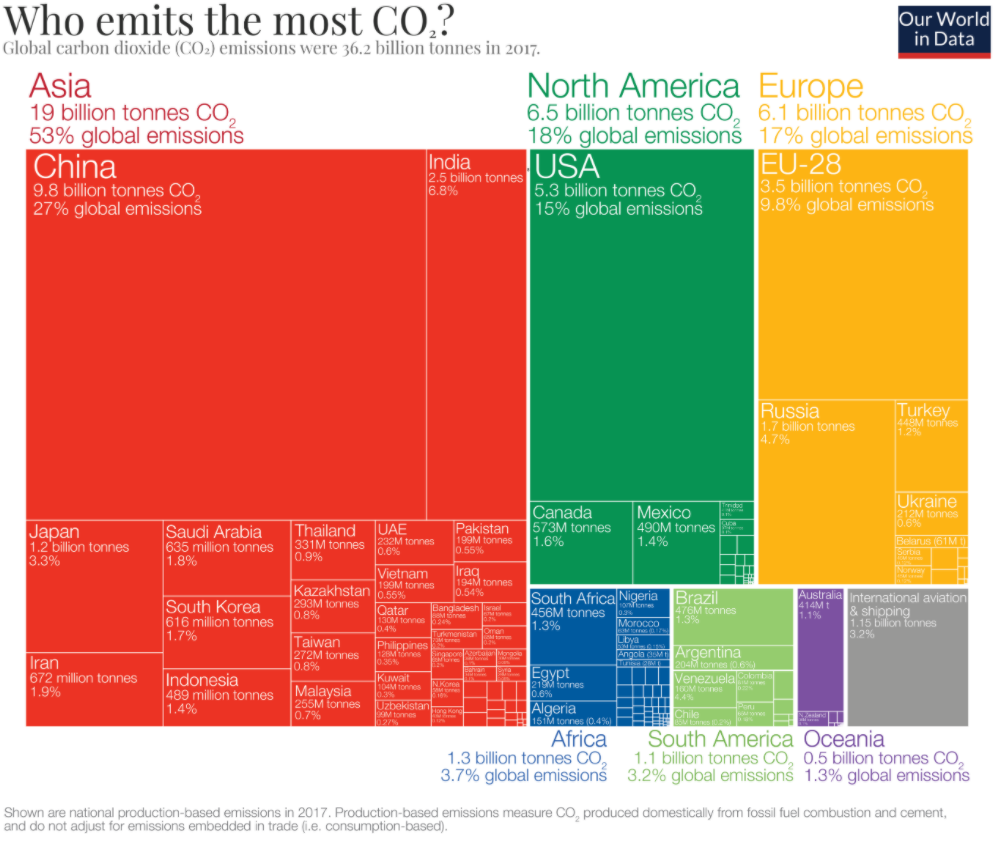
This is the U.S. share of global emissions as of 2018. The tree map chart below courtesy of Our World in Data (displaying 2017 data) helps to put this into perspective. While the U.S. remains the second-largest source of emissions behind China, we are a shrinking slice of a growing pie (or in this case, rectangles).
As President Biden’s Special Presidential Envoy for Climate John Kerry recently noted, “almost 90 percent of all of the planet’s emissions— global emissions—come from outside of U.S. borders. We could go to zero tomorrow and the problem isn’t solved.” This illustrates the immense importance of ensuring that emissions-reducing technologies are affordable and achievable for adoption by developing countries.
Collectively, these statistics on energy demand and emissions lead to an unsurprising but indisputable conclusion: energy decisions in the developing world will be pivotal to efforts to address climate change. In turn, those decisions will largely be dependent on making clean energy cheap enough for widespread adoption in these countries. Recognition of this fact should make it abundantly clear that growing investments in climate technology solutions is not just a nice-to-have asterisk within a broader climate strategy—it is an imperative. Which leads us to the final number-to-know, and perhaps the most compelling figure of all…
7) 45 PERCENT
According to the International Energy Agency 2020 Energy Technology Perspectives report, this is the amount of future global emissions reductions necessary to meet midcentury net zero goals that would be required to come from technologies which do not yet exist on a commercial scale (illustrated in the “Faster Innovation” bar of the IEA graphic below). IEA’s report also undertakes modeling to examine a “Reduced Innovation” case, and finds that a slower pace of innovation and delayed funding of demonstration projects by just five years would have a major impact on efforts to reach net zero targets.
As GEI President Marty Durbin stated in a recent op-ed, “a multitude of emissions targets exist at the state, local, and international levels, as well as from a growing number of businesses. What is not well appreciated, however, is that these ambitious energy transition goals are highly dependent on technologies that simply don’t exist commercially today…As such, the ultimate attainment of these goals could hinge on the success and full funding of the policies and programs borne from the Energy Act of 2020.”