It’s no secret that the COVID-19 pandemic disrupted many aspects of American life, and the energy and environmental trends that we monitor here at Fuel for Thought are certainly no exception. While it is well understood that traffic congestion, vehicle use, and air travel—and their corresponding emissions—took a nosedive in 2020, until now we didn’t have the full picture on the pandemic’s impacts on electricity usage. With recently released full-year 2020 energy statistics now in hand, we can now take a closer look at these impacts—and the results are quite interesting.
Based on our review, two primary takeaways—illustrated in chart form below—emerge: (1) COVID-19 lockdowns drove industrial, commercial, and residential electricity demand in different directions; and (2) while overall electricity demand declined modestly, emissions fell a whopping ten percent, as generation from natural gas and renewables continued to displace coal, particularly through the first half of 2020.
Now let’s take a more detailed look at the three categories previously mentioned—sales, generation and emissions. Sales and generation data explored here comes from the U.S. Energy Information Administration’s recently released
Electric Power Monthly (EPM), while emissions estimates are drawn from the EPM as well as EIA’s Monthly Energy Review.
Electricity Sales
Total electricity sales in 2020 fell 3.9% below 2019 sales. With this decline, sales fell back to approximately the same level as in 2005. Annual electricity sales overall have shown only modest changes throughout that period, as improved energy efficiency has largely offset the effects of population and GDP growth.
As shown in the chart below, a closer look at the month-to-month patterns by end-use sector illustrates the effects of COVID-19. Except for December, overall sales in every month were below those of the same month in 2019. The largest drops were in the March to May period, during widespread lockdowns at the beginning of the pandemic, and again in the September to November period.
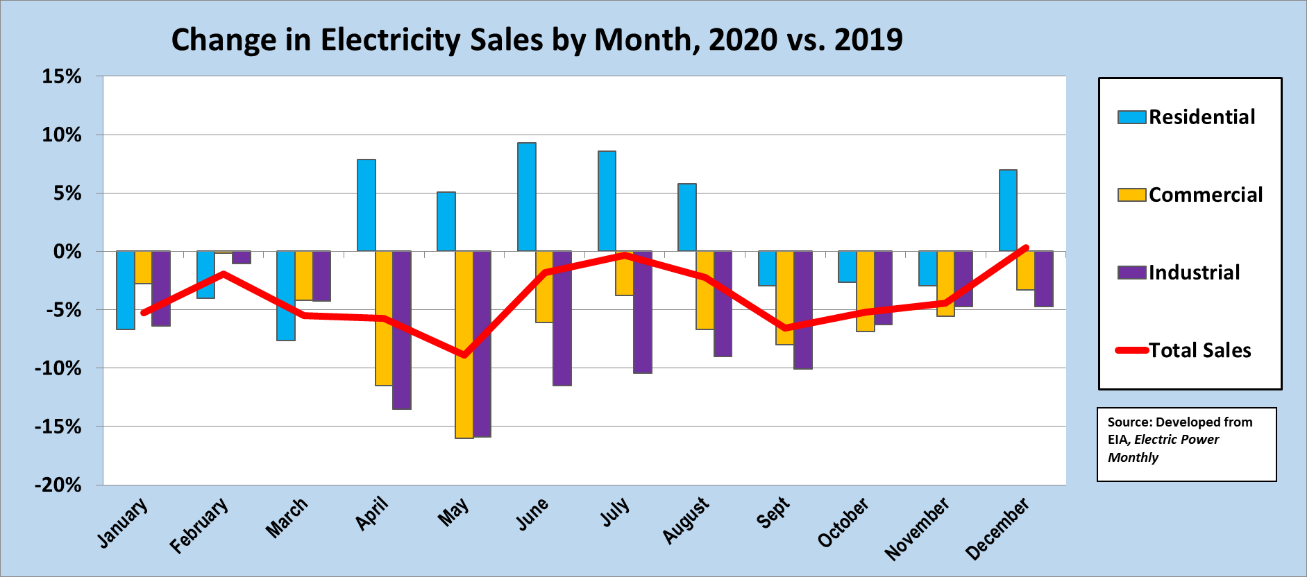
The decline in electricity sales was, not surprisingly, concentrated in the commercial and industrial sectors. This reflects the effects of lockdown directives, less manufacturing and industrial activity related to the GDP decline, and an increase in e-commerce. Compared to 2019, commercial electricity sales fell 6.3 percent, and industrial sales fell 8.3 percent.
Conversely, with office buildings closed and millions of Americans directed to work from home, residential electricity sales rose 1.5 percent in 2020, with demand peaking in the spring and summer at roughly 5-10% higher than 2019 levels.
To some extent, electricity sales are also affected by year-to-year temperature changes. Residential electricity use tends to be well-correlated with heating and cooling degree-days (affecting heating and A/C needs), and commercial electricity use somewhat correlated. However, it appears that 2020 compared to 2019 overall shows only about two percent more cooling degree-days (more A/C) but about ten percent fewer heating degree-days (less space heating). Overall, however, the year-to-year change is modest compared to some other years, and thus is only a secondary factor to the COVID-driven changes described above.
Generation Trends
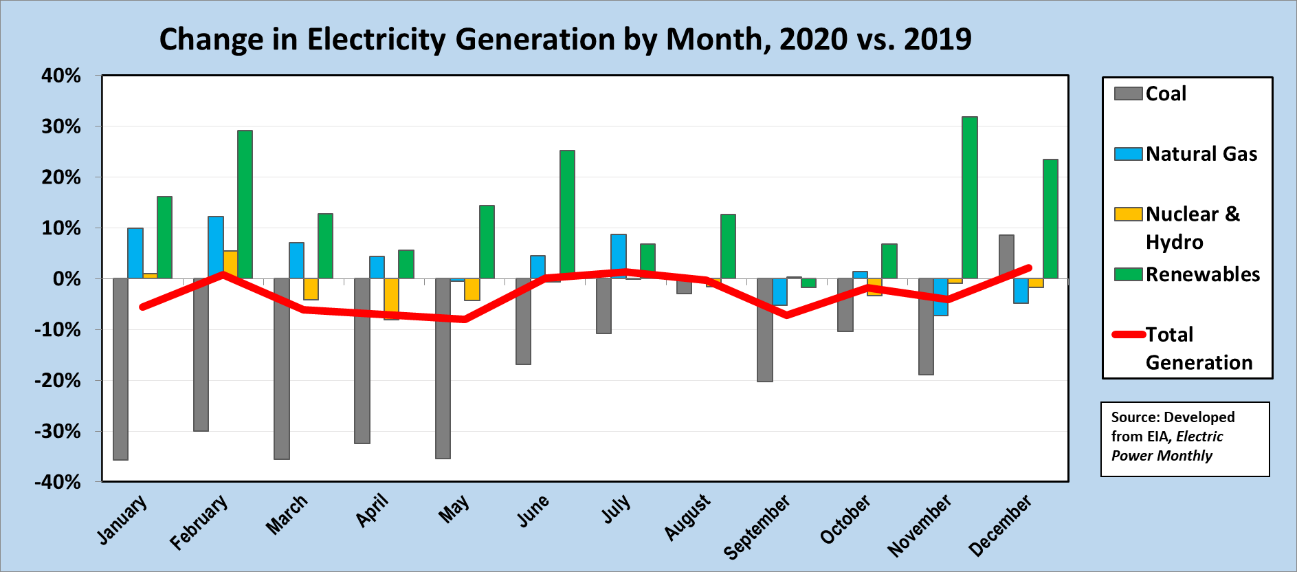
Total generation tends to track total electricity sales, and in 2020, with electricity sales declining 3.9%, total generation fell 2.8% (minor differences occur due to distribution losses and other grid activities). The largest monthly declines in generation were seen in the spring and fall seasons, when generation was as much as 10% below the same-month in 2019.
Continuing trends from prior years, coal-fired generation saw the largest decline, largely as a result of low natural gas prices and growing renewables capacity. Overall, coal-fired generation fell 19.9% from 2019 to 2020, with the spring months showing more than a 30% decline.
Natural gas-fired generation increased 2.4% during 2020, despite the decrease in total generation. With low prices over much of the year, natural gas-fired generation continued to take market share from coal.
As the installed base of wind and solar continued to increase in 2020, renewable generation rose along with it. Generation from renewables was higher in nearly every month during 2020 compared to 2019, showing an annual increase of 14.8%.
CO2 Emission Trends
Unlike some other emission streams, calculating the CO2 from power generation is a straightforward exercise.
Coal is the highest carbon source among fossil fuels. Natural gas emits CO2 at one-half to one-third that of coal. Wind, solar, nuclear, and hydro are evaluated as non-carbon emitting.
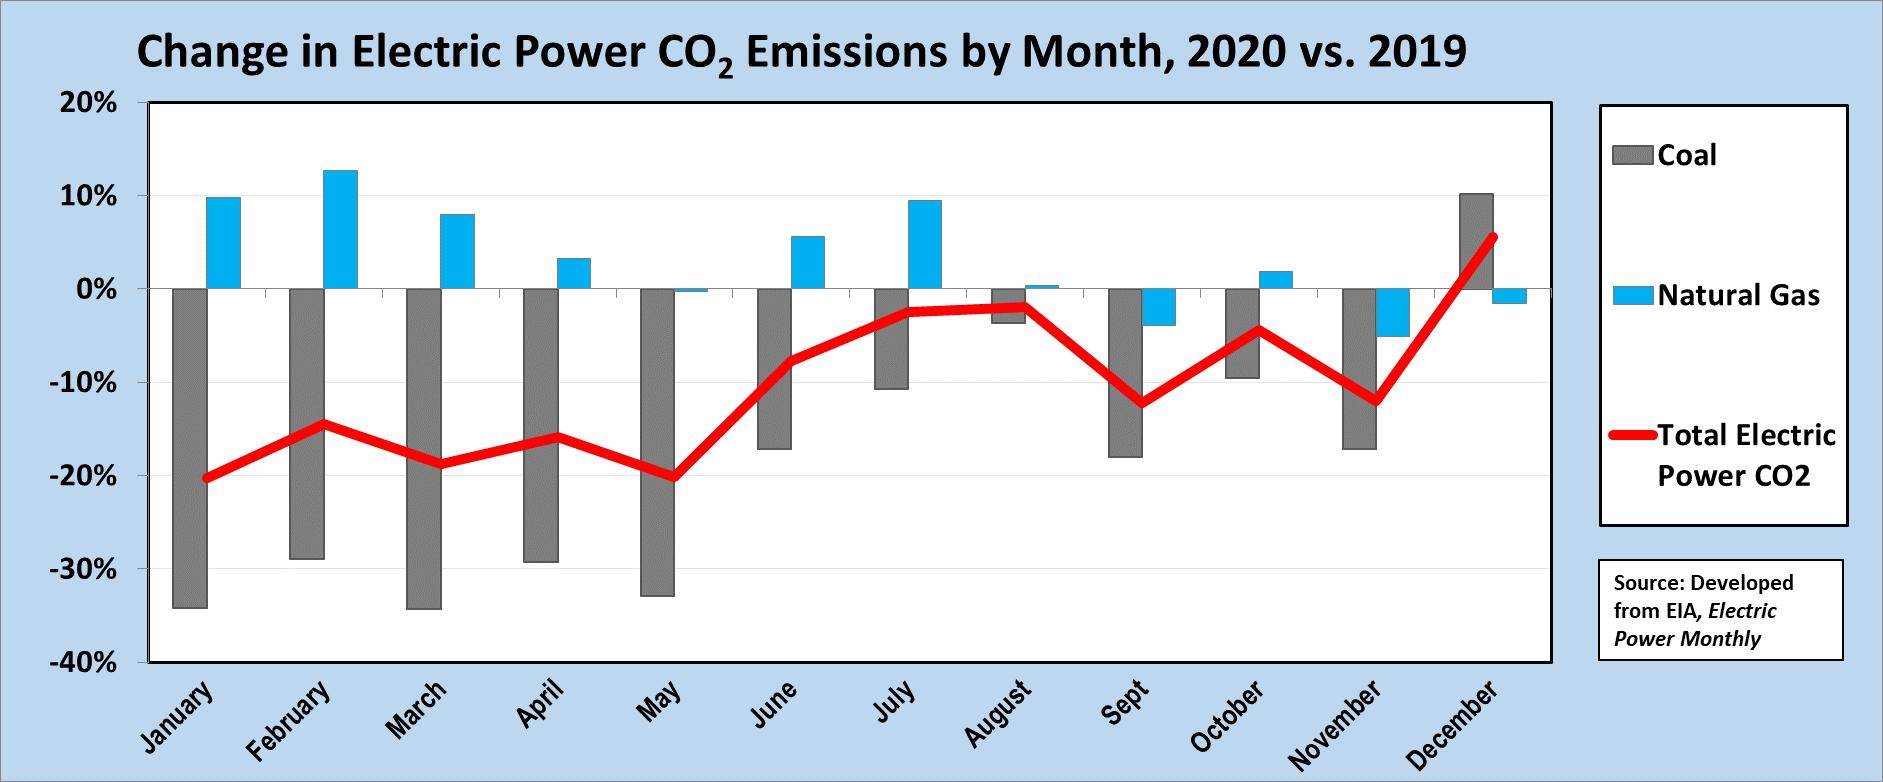
Based on this, we estimate that electric power CO2 emissions dropped by 10 percent compared to 2019 levels—a decline of 162 million metric tons. Part of this is the overall 2.8% drop in generation, as noted above. But the bigger part is the shift among generation sources, mainly from coal to natural gas and renewables. The 19.9% drop in coal-fired generation led to an 18.8% drop in its CO2 emissions. Meanwhile, natural gas-fired generation increased by 2.4%, leading to a 3.2 percent increase in its emissions.
The biggest changes in CO2 emissions occurred in the first months of 2020, when low natural gas prices and COVID-19 impacts depressed overall electricity sales and generation, as well as shifting more of that from coal to gas-fired generation. As the chart above shows, these emissions reductions began in January of 2020 and thus are only partially due to the COVID-19 pandemic.
Near the end of March, EIA will publish the Monthly Energy Review, showing the first full-year, though still draft, estimates of 2020 energy-related CO2 emissions by fuel and by sector. Fuel for Thought will take a deeper dive into this data, analyzing trends and underlying drivers.