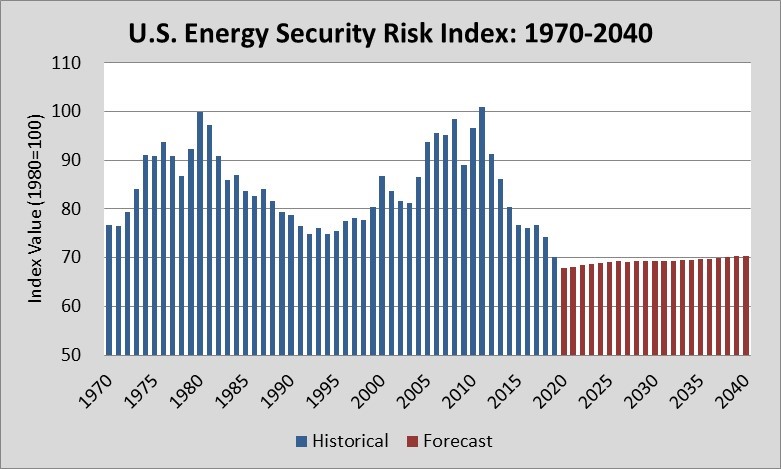
The energy security of the United States in 2019 was the most secure it has been since 1970, according to data in the 2020 edition of the annual Index of U.S. Energy Security Risk.
Covering 1970 to 2019, with a forecast out to 2040, the Index measures energy security based on 37 different metrics across a broad range of geopolitical, economic, reliability, and environmental risk factors. Like a golf score, the lower the Index score, the better our energy security.
In the eight years since the U.S. risk score peaked at 100.9 in 2011, it has plunged 30.7 points (30%) to 70.1 in 2019, an unprecedented rate of progress. The previous historic low was in 1992.
The tremendous increase in domestic energy production from the U.S. shale revolution—driven by the use of advanced hydraulic fracturing, horizontal drilling, and seismic imaging technologies—is the primary cause of the dramatically-improved security posture, especially in areas related to imports, prices, and emissions. Greater efficiency also played a role.
Looking to the future, forecasts prior to the COVID-19 pandemic indicate consistently low energy security risks out to 2040.
Highlights of the 2020 report include the following:
- Total risks reach record low in 2019: After achieving a record high risk score in 2011 of 100.9, the total U.S. energy security risk score fell in seven of the last eight years, achieving a record low of 70.1 in 2019, a 5.5 % decline from 2018.
- The U.S. became a net exporter of energy in 2019. For the first time since 1952, the U.S. achieved net overall energy independence, exporting more energy than it imported. This resulted from a combination of a very large increase in domestic oil and gas production, on top of steadily improving energy efficiency and conservation.
- Decreasing risks in 2019 were broad-based, with 21 metrics showing declines of at least 1%, and nine metrics achieved their lowest score in 2019. Most of the total decline in risk, however, can be attributed to large drops in fuel import-related metrics, with metrics measuring oil and natural gas import expenditures as a share of GDP and petroleum imports approaching zero in 2019. Oil prices continued their declined 11.4% in 2019 from its increase in 2017, falling about 11%, while the metric measuring energy-related carbon dioxide emissions also fell significantly (nearly 12%).
- Domestic crude oil output rose an extraordinary 11.3%, or nearly 1.3 million barrels per day (bbl/d), to nearly 12.2 million bbl/d in 2019. The volume produced in 2019 has never been exceeded, and the United States was the world’s largest producer. Texas had by far the largest volumetric increase of any state in 2019 (662,000 bbl/d.
- Natural gas production rose to a record level in 2019, climbing 10.6% to 40.7 trillion cubic feet (tcf). The United States led the world in natural gas production in 2019. Increases in Texas (1.3 tcf) and Pennsylvania (0.8 tcf) accounted for the majority of the increase. West Virginia, Louisiana, New Mexico, Oklahoma, Ohio, North Dakota, and Colorado also contributed increased output.
- After rising in 2018, crude oil prices dipped 11% in 2019, from $72.58 to $64.30 per barrel. The decline in price was not enough to affect domestic crude oil production appreciably, as output increased to record levels.
- All metrics measuring energy use efficiency or intensity risks showed improvement in 2019, with five metrics showing their lowest (best) score on record since 1970. These include the six metrics in the energy use intensity category and the average miles per gallon for the light vehicle fleet. Improvements in all of these metrics have been steady over the decades since 1970. Improvements in 2019 ranged from 1.4% to 5.8%.
- Risks related to all metrics in the environmental group declined in 2019. Total carbon dioxide emissions from energy have fallen 870 million metric tons and in 2019 stood 14.5% below the 2005 level (a commonly used benchmark).
- Pre-COVID-19 forecast indicated low risks out to 2040. Based on EIA’s AEO 2020, we expect an average U.S. risk score of 69.3 from 2020 to 2040, ranging from 67.9 to 70.4. These are by far the lowest projected figures we have ever calculated using EIA’s annual forecast, the first time being in 2010. The impact of the COVID-19 pandemic will certainly affect, and probably increase, risks in the short term. However, many of the favorable trends noted here will likely resume in the years ahead and keep future risks low.
- The forecast suggests three additional metric risks scores are expected to fall to zero in 2020. In addition to the metric for natural gas import risk, which reached a score of zero in 2017, the risk scores for petroleum import risk, oil and natural gas import expenditures, and oil and natural gas import expenditures per GDP are slated to hit zero in 2020.
As this latest edition of the Index illustrates, the outlook for our future energy security is as promising as ever. While we may not be able to predict future geopolitical events with any confidence, we are in a much better position to overcome unforeseen circumstances and mitigate any risk to our economy and security.
The Index and its companion, the International Energy Security Risk Index, are available on our website.