Stephen Eule
[This is an updated version of this report. Last update August 10, 2015]
In recent testimony before Congress, the Energy Institute’s Karen Harbert took the Obama Administration to task for failing to explain how the country was supposed to meet the greenhouse gas emissions goal outlined in the Intended Nationally Determined Contribution—or INDC—it submitted to the United Nations. It looks like others are beginning to catch on.
The INDC will form the basis of the U.S. commitment under a new UN climate treaty to be worked out in Paris later this year. In it, the administration pledges that the United States will slash its net greenhouse gas emissions at least 26%, and aim for 28%, below the 2005 level by 2025. (Net emissions include “sinks,” that is, withdrawals of carbon dioxide from the atmosphere by forests.)
Here’s the problem: To meet the 28% target, net greenhouse gas emissions will have to plunge about 1,790 million metric tons of carbon dioxide equivalents (MMTCO2) below the 2005 level by 2025 (to 4,600 MMTCO2).
Not only is this goal completely unrealistic, jeopardizing our energy advantage with potentially ruinous consequences for the economy and employment. The administration also has failed to tally how the programs mentioned, however briefly, in its INDC will achieve it. And little wonder, because once you crunch the numbers, it’s clear they don’t add up, leaving nearly one-third of the president’s total goal unexplained.
In evaluating the administration’s INDC 28% goal, we used the Energy Information Administration’s Annual Energy Outlook 2015, EIA’s Analysis of the Impacts of the Clean Power Plan, the Environmental Protections Agency’s (EPA) U.S. Greenhouse Gas Inventory Report: 1990-2013, EPA's Regulatory Impact Analysis for the Clean Power Plan Final Rule, the U.S. Climate Action Reports 2014 (CAR 2014), government fact sheets and Federal Register notices, and other sources to calculate a baseline estimate of future greenhouse gas emissions and estimates for reduction that could be reasonably expected from announced programs. This analysis supposes, or course, that all of these policies, including those that have been bruited but not formally proposed yet, are implemented in a timely manner and survive political and legal challenges—a dubious proposition in the case of the Environmental Protection Agency’s Clean Power Plan.
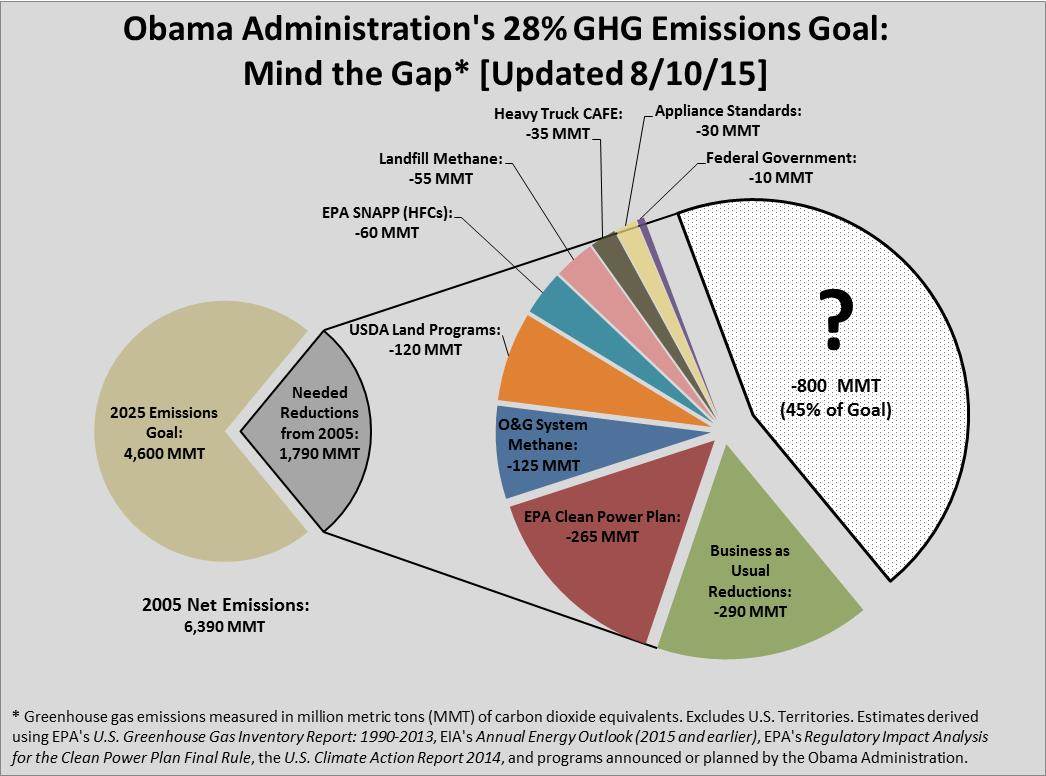
Based on our analysis, we estimate that in 2025, without further administration policies, net emissions would be around 6,100 MMTCO2, about 290 MMTCO2 lower than the 2005 level. This is a much larger contribution from Business as Usual that owes much to EPA’s revised Clean Power plan baseline forecast, which includes a larger role for renewables power and energy efficiency in the power sector than in EIA’s AEO 2015. Achieving the 28% goal would still require a whopping 1,500 MMTCO2 left to achieve the 28% goal.
As the accompanying chart shows, new rules and programs the administration has announced or has planned could lead to a further 700 MMTCO2 of reductions in 2025 for a total reduction of (290 + 700 =) 990 MMTCO2.
Here’s how we arrived at the 700 MMTCO2 figure:
- EPA Clean Power Plan (-265 MMTCO2) [Updated]: This estimate is based on EPA’s Clean Power Plan Final Rule, and it represents a large change in the reduction estimates expected from this program. Some of this is explained by a shift in emission reductions from the Clean Power Plan to Business as Usual, as noted above. Nevertheless, the impact of EPA’s Final Rule is much smaller than in the analysis conducted by EIA on the proposed rule, which was the basis for the original estimate we posted on this. EIA projected that by 2025, power sector emissions would be 36% below the 2005 level. EPA’s more recent analysis in its Final Rule estimated that reduction in the power sector will be 28% to 29% below the 2005 level in 2025, a significant difference. As a result, we estimate a total emissions cut of about 265 MMTTCO2 from the Clean Power Plan. This lower estimate is largely responsible for the increase in the gap compared to the previous estimate.
- Oil and Gas System Methane (-125 MMTCO2): The Obama Administration expects methane emissions from oil and natural gas systems to increase 25% between 2012 and 2025—an estimate at odds both with recent trends and with the official forecast submitted to the United Nations just last year in the CAR 2014). Despite our misgivings, this grow rate was used to establish the baseline for these emission sources. The administration’s goal is a 45% reduction in 2025 emissions compared to 2012 emissions. We estimate this will yield a combined reduction in oil and natural gas systems of 125 MMTCO2.
- Department of Agriculture Land Programs (-120 MMTCO2): USDA estimates it Climate Smart Agriculture and Forestry program will reduce net emissions and enhance carbon sequestration by over 120 MMTCO2 in 2025. (For the 2025 baseline figure, we used average of the high and low sequestration scenario forecasts in CAR 2014, with some adjustments to take into account more recent data.)
- EPA Significant New Alternatives Policy Program (-60 MMTCO2) [Updated]: Under EPA’s Protection of Stratospheric Ozone: Change of Listing Status for Certain Substitutes final rule, some hydrofluorocarbons will no longer be listed as acceptable alternatives to ozone-depleting substances. Reductions from this proposed rule are estimated to be between 54 to 64 MMTCO2 in 2025. Here we take the average (≈60 MMTCO2).
- Landfill Methane (-55 MMTCO2): Without any kind of guidance to go on, we assume that the most recent five-year trend (2009 to 2013) in emission reductions of methane from landfills will continue at a somewhat faster pace, yielding a decline of 55 MMTCO2 in expected 2025 emissions.
- Heavy Truck Fuel Efficiency Standards (-35 MMTCO2): The administration has yet to propose fuel economy standards for heavy trucks. We assume it will be compatible with the most recent CAFE standards for light-duty vehicles and will kick in in 2018. First, we went back to the AEO 2012 and calculated the difference in emissions between the Reference case and the CAFE case—which modeled implementation of the administration’s proposal to raise the average fuel economy standard for light vehicles to 54.5 miles per gallon by 2025. We bumped this rate up modestly and applied it proportionally to the reference emissions from heavy trucks in the AEO 2015 for an estimated contribution of 35 MMTCO2 in 2025.
- Appliance Standards (-30 MMTCO2): To estimate emission reductions from appliance efficiency standards, we used the AEO 2014 and calculated the differences in emissions in the residential and commercial sectors between the Reference case and the Extended Policy case, which includes continuation and expansion of the appliance program. We then assumed a slightly faster reduction rate and applied it to the AEO 2015 reference case and made an adjustment to reflect reduced emissions from power generation as a result of the Clean Power Plan. This resulted in an overall estimated cut of 30 MMTCO2.
- Federal Government (-10 MMTCO2): The president issued an executive order requiring the federal government to lower it greenhouse gas emissions 40% from the 2008 level. This follows an existing goal of cutting the government’s emissions by about 25% from the 2008 level by 2020. Most of the 40% reduction, therefore, is already “baked in the cake.” We estimate that the recently announced goal will lower 2025 emissions by an additional 10 MMTCO2 from what they would have been otherwise.
Even with these fairly generous estimates, these measures, which include some programs that haven’t even been announced yet, would fall about 800 MMTCO2, or 45%, short of the president’s goal. How does administration intend to plug the remaining gap? It hasn’t said. When asked by the Financial Times about the holes in the administration’s INDC, White House official Rick Duke chose to deny existence of a problem and instead change the subject: “Our numbers are quite clear. It’s other countries where we see more opportunities to clarify what the plans are.”
EPA’s fiscal year 2015 budget request, however, provides a clue. It says the Agency will soon begin considering greenhouse gas regulations on the refining, pulp and paper, iron and steel, livestock, and cement sectors. So we can expect the industrial sector will almost certainly be on the hook for reductions, even though there is no reference at all to industrial emissions in the INDC. Still, seeing as the entire industrial sector emitted a little over 800 MMTCO2 in 2013, even very steep cuts by industry won’t deliver nearly what’s needed. Where the administration goes next is anyone’s guess.
We’re not alone. David Bailey and David Bookbinder, the principals at Element VI Consulting, reported similar results of their analysis in a blog post entitled “President Obama’s Dubious Climate Promises.”
In addition, the World Resources Institute, an advocate for aggressive climate regulations, issued a report that came to the same conclusion we have: reductions from announced programs and policies would fall far short of the administration’s 28% international commitment. WRI came up with its own regulatory wish list for reaching the president’s goal, which unsurprisingly includes new regulations on industrial and other sectors not now under EPA’s thumb and even more aggressive targets for already regulated sectors like electricity.
At any event, nearly four months after the INDC was released, we know no more about how the administration expects to meet its 28% goal than we did then. Todd Stern, the president’s chief climate negotiator, said that each nation’s INDCs should be structured so that its proposed actions “can be readily understood and analyzed.” It would be nice if the administration adhered to its own modest standard of transparency.
In the meantime, mind the gap.