As a signatory to the United Nations Framework Convention on Climate Change (UNFCCC), the U.S. is required to develop a national inventory of anthropogenic sources and sinks of greenhouse gases (GHGs). This has been done annually since the early 1990s, and earlier this month, the Environmental Protection Agency released a draft of its 2021 inventory for public comment. The latest data release goes through 2019, prior to the COVID-19 pandemic.
The report—Inventory of U.S. Greenhouse Gas Emissions and Sinks—details U.S. GHG emissions and sinks across various economic sectors and sources. Overall, the news in this year’s draft report is positive, with total net economy-wide emissions showing a 1.8% decline between 2018 and 2019, progress that continues to build upon modest but steady reductions since emissions peaked in 2007.
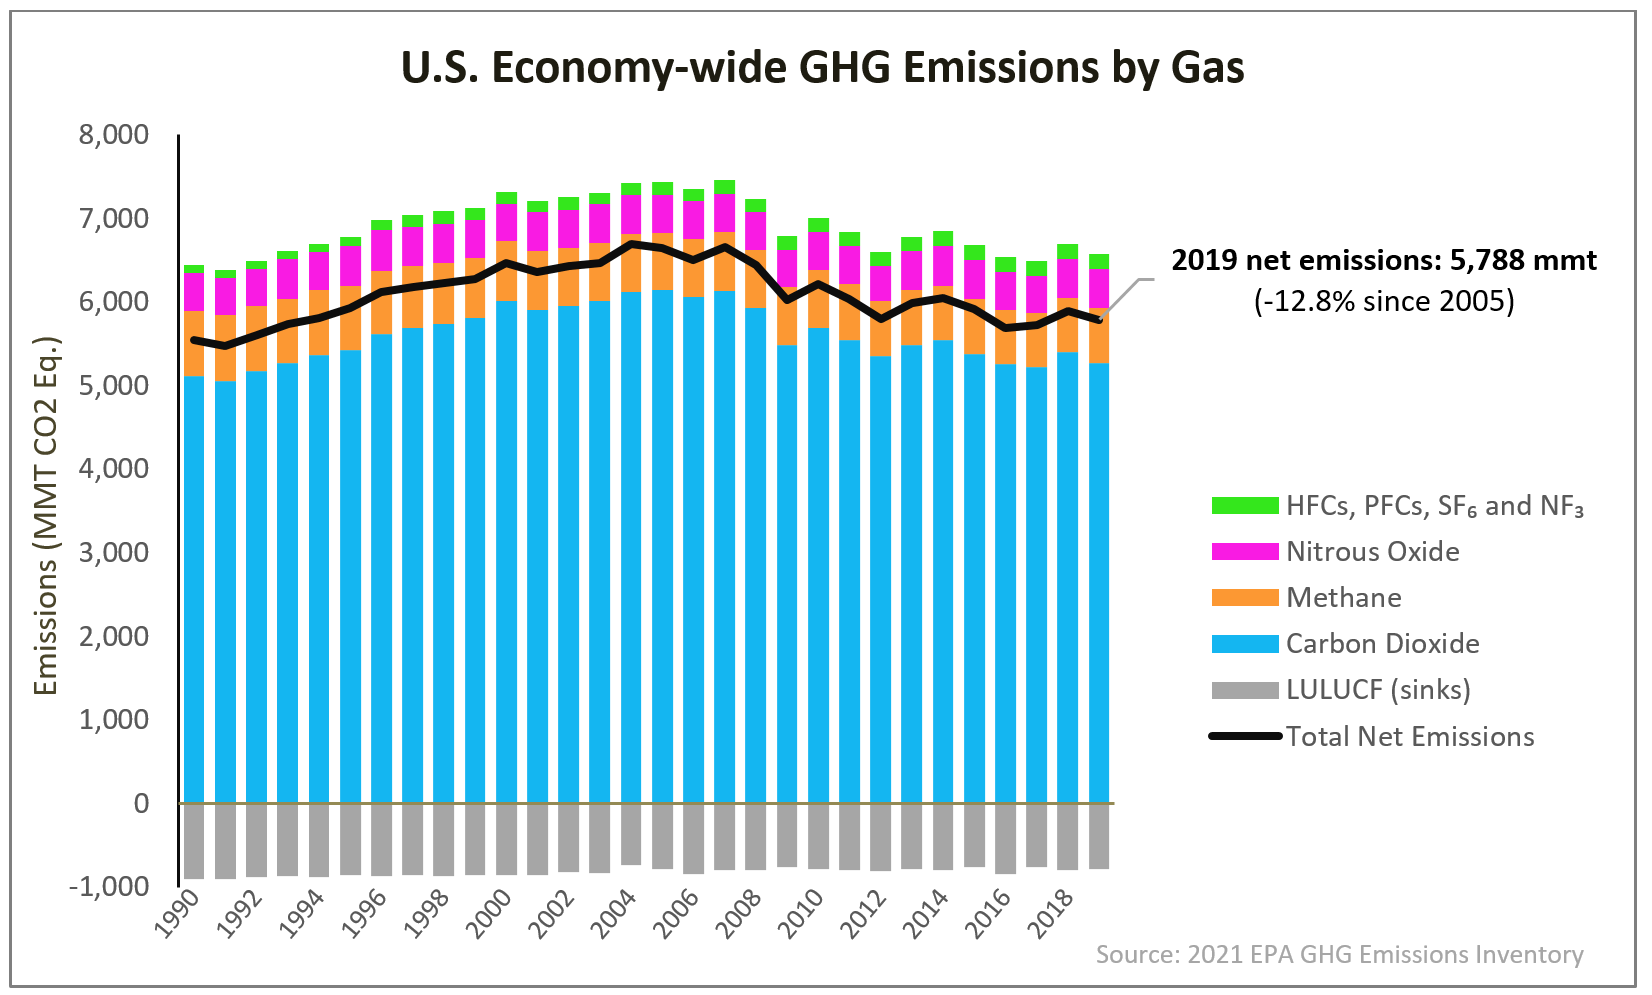
In EPA’s inventory, total net U.S. greenhouse gas emissions in 2019 were 5,788 million metric tons (MMT) of carbon dioxide equivalent (CO2e).[1],[2] As shown in the chart below, that’s nearly 13% below 2005 levels of 6,644 MMT—an important reference point because it will likely serve as the baseline year for U.S. emissions reductions commitments under the Paris Agreement. EPA’s new data also show that total 2019 emissions are now just 2 percent higher than they were in 1990—an especially remarkable accomplishment considering that the U.S. population and economy have respectively grown by 32% and 104% during this period.
Few (if any) countries around the world have been able to reduce emissions while growing their economy as effectively as the United States. In fact, between 2005 and 2019, net economy-wide GHG emissions have fallen by 855 MMT CO2e—an amount far greater than that of any other country, ever. Moreover, these emissions reductions have occurred alongside a growing economy—a recent break from historical norms. For decades, U.S. GHG emissions tended to rise in concert with population and economic growth, but in the mid-/late-2000s, the trends decoupled. What has driven this decoupling? In two words, natural gas and the shale revolution.
As the Energy Information Administration recently reported, a primary factor in carbon intensity decreases were “Increases in natural gas production from shale and tight resources that lowered the cost of natural gas production and made it cost competitive with coal for electric power generation.”
While affordable natural gas contributes to emissions reductions across the economy, its impact in the power sector has been profound. According to EPA’s inventory, electricity sector emissions have fallen by a remarkable 33% since 2005 (see chart). This is largely due to fuel switching to natural gas, as well as continued expansion of renewable energy resources driven by state-level renewable portfolio standards, federal tax policies, and commitments from the private sector.
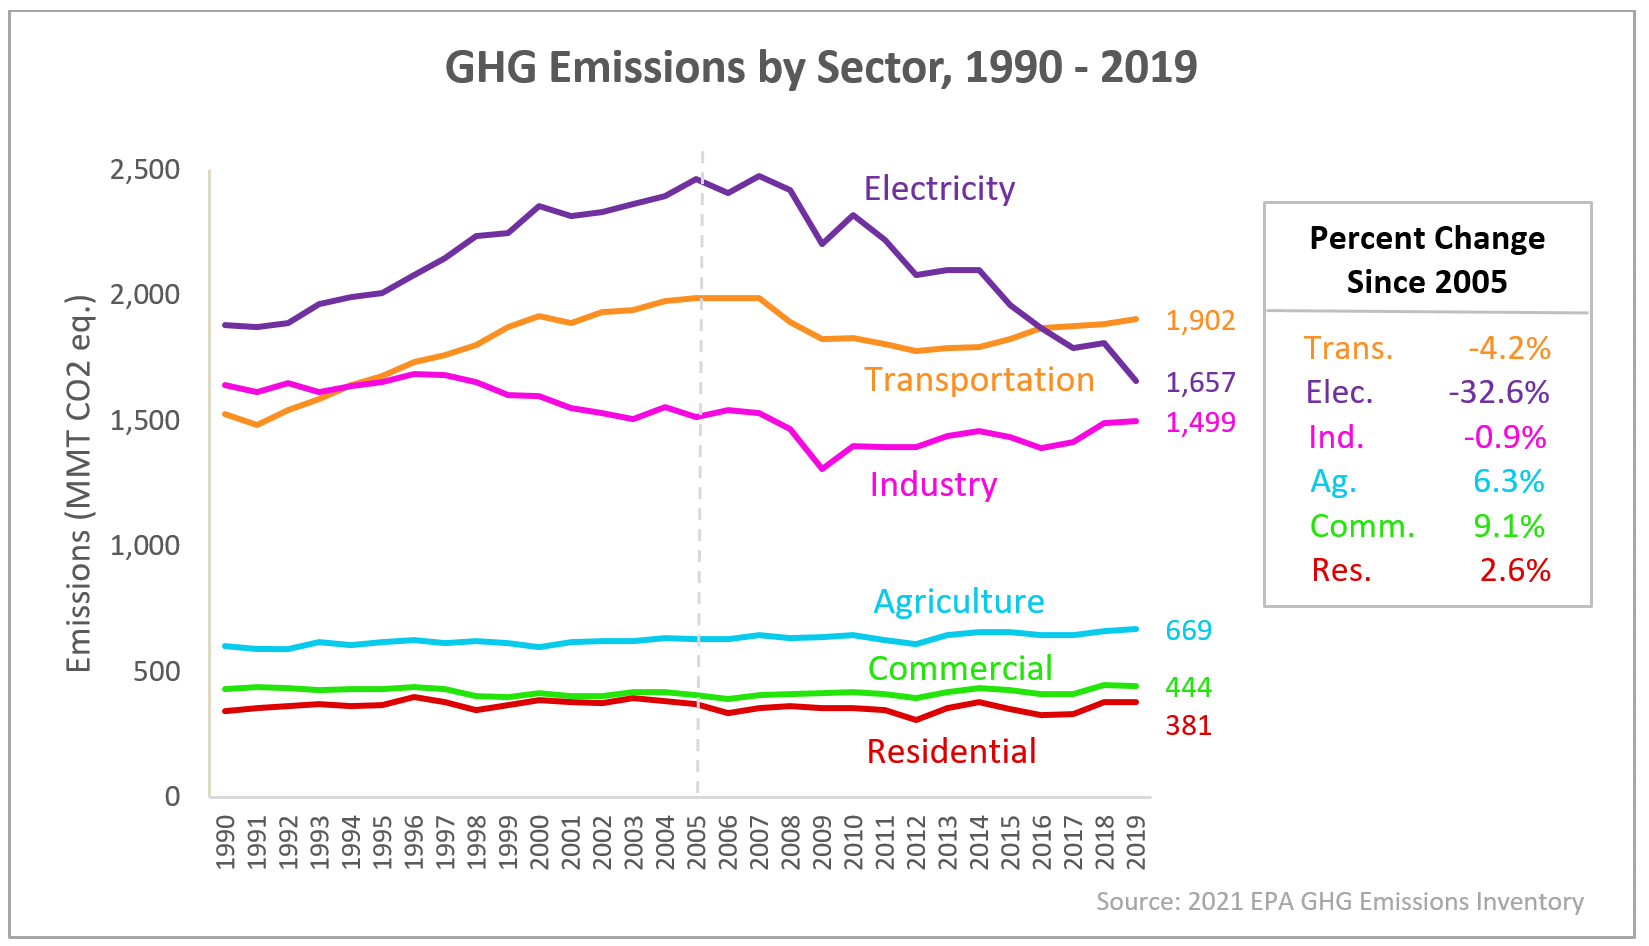
In this chart, it is clear that electric power sector emissions—nearly all of which are CO2 from fuel combustion—rose from 1990 to a peak around 2005 and have since plummeted by more than 32 percent. However, as they say in financial circles, past performance is no guarantee of future progress.
While natural gas, renewables, and other emerging technologies such as advanced nuclear, carbon capture and sequestration, and energy storage hold great promise for continued emissions reductions in the power sector and across the economy, significant technology breakthroughs will be needed to accelerate or even sustain recent trends. Moreover, as the chart illustrates, emissions reductions from other economic sectors have proven more challenging.
This is a major reason why the Chamber worked so hard to pass the Energy Act of 2020—historic climate and energy innovation legislation that expands federal efforts to develop emissions-reducing technologies across all economic sectors. With full funding, and the immense firepower of the U.S. science and technology enterprise, we’re confident that the Energy Act places us on a path to achieve the breakthroughs necessary for economy-wide emissions reductions not only in the U.S., but around the world.
Stay tuned for future Fuel for Thought posts taking a deeper dive into newly released data highlighting energy and environmental trends.
[1] The term “carbon dioxide equivalent”, or CO2e, refers to the tonnage of carbon dioxide emissions plus the tonnage of other greenhouse gas emissions, each weighted by their respective global warming potential. “Net emissions” is a measure that represents total economywide emissions minus GHG removal occurring through sinks (known as Land Use, Land Use Change, and Forestry, or LULUCF).
[2] EPA’s time trend of U.S. GHG emissions by gas make clear the dominant role of CO2 in the GHG inventory. About 80 percent of U.S. GHG emissions come from CO2. Another 10 percent is from methane (CH4), with the remainder from N2O, HFCs, and other less common but potent greenhouse gasses. Offsetting a significant portion of these gross emissions are emission “sinks” from removals from Land Use, Land-Use Change, and Forestry (LULUCF). In 2019, LULUCF removals totaled 788 MMT CO2e—enough to offset gross emissions by 12 percent.