Things are happening so fast in the U.S. energy sector that the U.S. Energy Information Administration (EIA) is having a tough time keeping up. You really can’t blame the agency because America’s energy producers just keep exceeding everybody’s expectations.
EIA’s just released Annual Energy Outlook (AEO2019) contains more than a few pleasant surprises. The AEO is the federal government’s official energy forecast covering production, consumption, imports, and exports of all major energy sources. While EIA runs a number of different scenarios, we’ll just explore the “reference” case, sort of the middle-of-the-road forecast based on current policies. As we always point out, this is a forecast, not a prediction. Changes in policies, laws, technologies, GDP growth and other factors would obviously change the future.
With those caveats, here are some of the high-level results.
- Crude Oil Production Sets Records—Again: Last year we reported that EIA’s AEO2018 was projecting that U.S. crude oil production, mostly tight oil, would exceed 11 million barrels per day (MMbbl/d) by 2022 and fluctuate between 11 and 12 MMbbl/d out to 2050. This year EIA is forecasting that by 2020 U.S. crude oil production will blow past 13 MMbbl/d and by 2025 bust 14 MMbbl/d and will stay above this level to 2040 (Figure 1). Since 2010, the amount of crude produced domestically has just about doubled (up 96%) and by 2025 EIA expects it will be 164% above the 2010 level. At the risk of repeating ourselves: Wow. The economic and geopolitical implications of this are huge. Given all the turmoil in places like Venezuela, the Middle East, and elsewhere, we can be thankful that U.S. producers have helped keep the lid on the price spikes that normally accompany such instability.
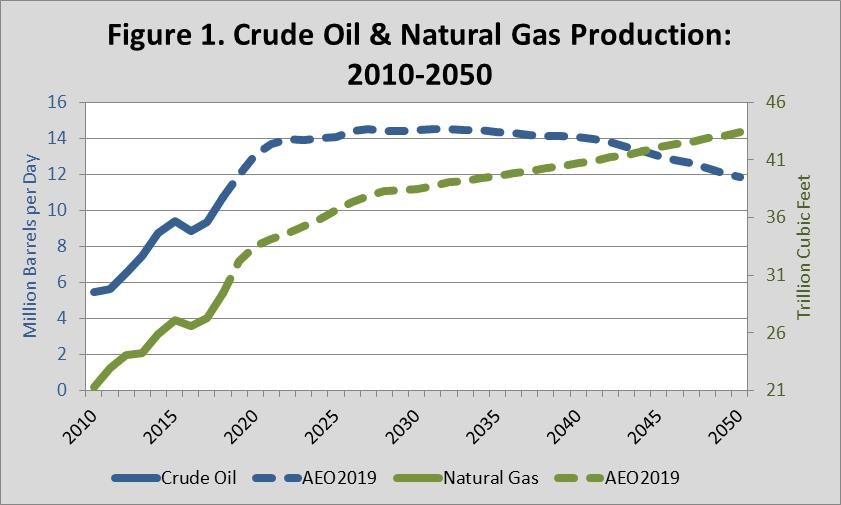
- Natural Gas Output Continues its Healthy Growth Trend: A lot of natural gas is produced as a by-product of crude oil production, so it’s no surprise that domestic production of this fuel is also expected to grow. EIA forecasts production of natural gas to leap 60% out to 2050, from 27.2 to 43.4 trillion cubic feet, with each year exceeding the record set the year before. Ho-hum, more production records. The U.S. is now the world’s largest producer of this fuel, and EIA’s projection suggest it will not relinquish its status anytime soon (Figure 1). Production increases will help feed greater demand for gas in the power and industrial sectors, and exports will continue to increase. Plentiful natural gas supplies mean that the spot price should stay below $5.00 per million Btu all the way out to 2050, a much lower level than forecast a few years ago.
- Natural Gas Exports Grow: In 2017, the United States became a net exporter of natural gas for the first time in decades. EIA forecasts that by 2050 annual net exports should increase to a bit more than 8 trillion cubic feet. While shipments by pipeline to Canada and Mexico should increase, by the mid-2020s shipments of liquefied natural gas—LNG—by seagoing vessels should exceed pipeline deliveries.
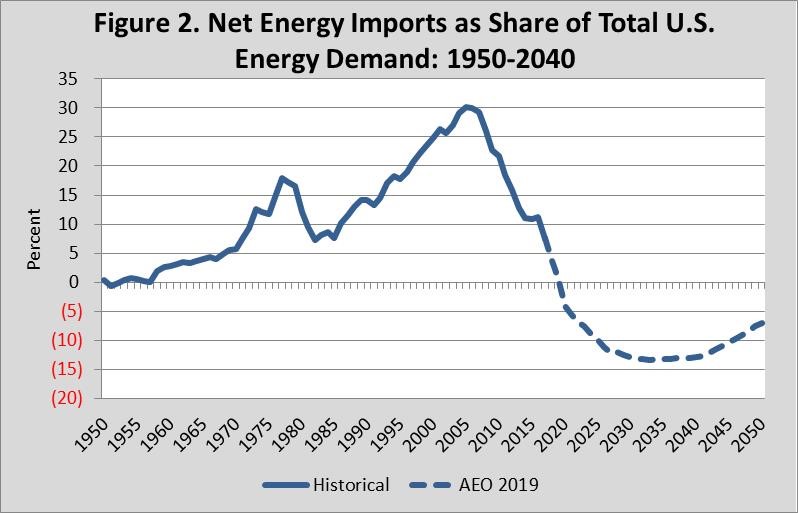
- Energy “Self-Sufficiency” Moves Closer Still: The Global Energy Institute was, in the 2015 edition of our U.S. Energy Security Risk Index (see the foreword to that report here), the first to point out that sometime before 2030 the U.S. would export more energy than it imports, something that hasn’t happened since the early 1950s. We pointed out then that if the future unfolded closer to EIA’s optimistic “High Oil and Gas” scenario instead of the reference scenario, we might see exports exceeding imports by 2025. The latest AEO2019 reference scenario now projects that next year—in 2020—the United States will achieve that milestone (Figure 2), five years ahead of even the most optimistic scenario in 2015. Whoa. The primary reason for this is the shale revolution, though relatively flat energy demand also gets a share of the credit.
- Hydrocarbons Will Remain Dominant: Hydrocarbon sources of energy still dominate energy supplies in 2050. From a share of about 82% today, they are expected to provide 79% of U.S. needs in 2050. Both petroleum and coal see their shares of the energy mix decline from 38% to 35% and from 13% to 10%, respectively, while natural gas sees its share increase from 30% to 34%. The largest relative increase in market share, however, is in non-hydro renewables (including biomass), which are expected to climb from nearly 7% today to 12% in 2050.
- Oil Prices Rise Slower than in Previous Forecasts: Many factors that go into the price of a barrel of crude oil, but the really strong numbers for U.S. production going forward will put downward pressure on prices. So while prices may rise in the future, it is likely that the rise will be more modest than it would have been without U.S. production growth. By 2050, EIA expects the price of a barrel of crude oil will be about $108 (real 2018$). That’s about 7.5% less than the 2050 price EIA forecasted last year. One thing we have learned over the years, however, is that geopolitical and other events can have a tremendous impact on markets, which means that the price of crude oil rarely travels the smooth path in EIA’s forecasts.
- Energy Consumption Rises Modestly: U.S. energy demand will increase about 6.5% between 2018 and 2050, an average of about 0.2% per year. Industrial energy use is forecast to jump 26% by 2050 and commercial energy use to rise 5%. Residential and transportation energy use both decline. The use of more energy efficient technologies and an economic shift away from energy-intensive industries and towards service industries have tended to lower energy demand forecasts in recent years. Comparatively low energy prices in the United States, however, have buoyed industrial energy consumption.
- Energy Intensity Continues to Get Better: Overall, the energy intensity of the U.S. economy—the amount of energy it takes to produce a dollar of GDP—continues to decline. EIA forecasts that this measure will improve 41% out to 2050, which means it will take 41% led energy to make a buck.
- Electricity Demand Grows: Although EIA doesn’t expect total energy demand to grow very rapidly out to 2050 (0.2%), it does forecast much more rapid demand growth for electricity. This marks a continuing shift in energy use away from fuels and towards electricity. EIA projects that sales of electricity will grow 0.8% per year to 5.2 trillion kilowatt hours in 2050 from 4.0 trillion kilowatt hours in 2018. That’s a total increase of 31%. All economic sectors—residential, commercial, industrial, and transportation experience demand growth. While demand from electrified transportation grows the fastest because of greater use of battery-powered vehicles, the largest volumetric increase is in the industrial sector.
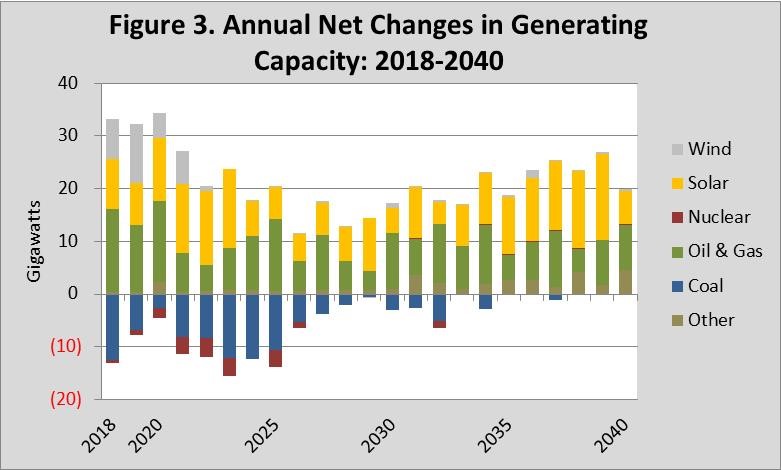
- Significant Shifts in Electricity Generation Mix: By 2050, the generating mix of the power sector will be considerably different than it is today. The share of our electricity generated from coal is expected to decline 28% to 17% while electricity generated from natural gas is expected to rise to 34% from 39%. Renewable sources, including hydropower, are expected to account for 31% of our electricity generation compared to about 18% today. Solar is set to increase a whopping 715% by 2050 to account for 15% of our electricity. Figure 3 shows annual net changes in capacity for various power-generating technologies out to 2050. The large and consistent annual additions of natural gas and solar capacity (green and gold bars, respectively) are readily apparent. The chart also shows that after the production tax credit for wind power expires in the early 2020s, additions of wind power pretty much come to a halt.
- Average Electricity Prices Stay Low: Average electricity prices are anticipated to stay essentially flat from 2017 to 2050, a remarkable turn of events from recent AEOs that showed significant price increases, especially Reference case projections that included the Clean Power Plan. Rates rise fastest in the transportation sector, reflecting the increase in electricity demand for battery-powered and plug-in hybrid vehicles. The commercial and industrial sectors see declining electricity prices, maintaining a huge competitive edge for U.S. industries.
- Energy-Related Carbon Dioxide Emissions Decline: Under the current suite of policies, EIA forecasts that energy-related carbon dioxide emissions decline by 4.3% by 2050, a rate of about 0.1% a year. Emissions for every sector declined except for the industrial sector. In the industrial sector, EIA is forecasting increased use petroleum and natural gas.
As you digest all of this good news, keep in mind that it wasn’t all that long ago that America’s energy revolution was expected to be a short-lived blip on trajectory leading us to greater energy scarcity. Yet over nearly the past decade, each yearly edition of the AEO has forecast even stronger performance than the year before. Our energy future is indeed looking as bright as it has ever been since EIA started looking into its crystal ball, and it doesn’t show any signs of slowing down.