This week, the U.S. Energy Information Administration (EIA) released its latest annual forecast of U.S. energy, the Annual Energy Outlook 2018 (AEO2018). This year’s edition goes out to 2050 and provides a look at where the agency thinks production, consumption, imports, and exports of all major energy sources in the United States are headed. We have prepared a comprehensive analysis of the AEO2018 which you can find here. For those looking for just the highlights—keep reading!
Before we get going, it’s good to remember this caveat from EIA: “Projections in the [AEO2018] are not predictions of what will happen, but rather modeled projections of what may happen given certain assumptions and methodologies.” It’s also important to understand that EIA operates under constraints that require it to model current policies. So for example (and as we’ll see below), AEO2018 assumes the subsidies for solar and wind will phase down in accordance with current law. If the law changes and the subsidies are extended, as some may hope, that would obviously change the outlook for these technologies. But at least in the baseline forecast, EIA doesn’t, and isn’t supposed to, make assumptions about future policy beyond what’s on the books already. So what that in mind, let’s take a look at some of the high-level results.
- Energy “Self-Sufficiency”: The United States will become a net energy exporter by 2022, primarily because of increased domestic production—the shale revolution—with an assist from modest energy demand growth.
- Hydrocarbons Still Rule: Hydrocarbon sources of energy will still dominate energy supplies in 2050, providing 79% of U.S. needs in 2050.
- Domestic Supply & Demand: U.S. energy production is expected to increase at a rate of 0.8% annually and by 2050 will increase a total of 31%. Consumption will increase about 13% between 2017 and 2050, an average of about 0.4% per year.
- Domestic Crude Oil Production Sets Records: EIA projects that U.S. crude oil production, mostly tight oil, will in 2022 breech 11 million barrels per day and fluctuate between 11 and 12 million barrels per day out to 2050 (see the nearby chart). That’s a sustained rate 2 million barrels per day higher than the previous U.S. record of 9.6 million barrels per day set in 1970. Astonishing.
- Natural Gas Sets Records, Too: As the chart shows, EIA expects production of this fuel to jump an astonishing 58% out to 2050, from 27 to 43 trillion cubic feet, which should keep the U.S. as the world’s largest producer.
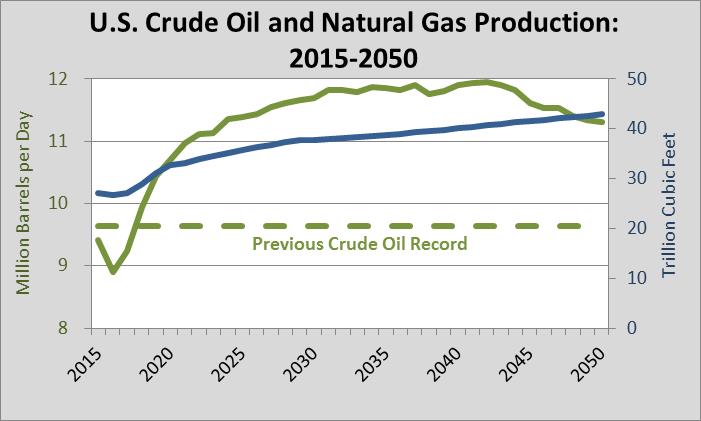
- U.S. a Net Natural Gas Exporter: In 2017, the U.S. became a net exporter of natural gas for the first time since 1957. By 2027, net exports are expected to exceed 5 trillion cubic feet from just 0.09 trillion cubic feet in 2017.
- Oil Prices Rise Steadily: Crude oil prices rise gradually in EIA’s current projection and don’t top $100 per barrel until 2036, before climbing to about $113 per barrel in 2050.
- Electricity Demand: EIA projects that sales of electricity will grow 0.9% per year to 5.1 trillion kilowatt hours in 2050 from 3.8 trillion kilowatt hours in 2017.
- Renewables: Both wind and solar capacity additions dip in the early 2020s with the expiration of the Investment Tax Credit for solar and wind and the Production Tax Credit for wind. After 2022, EIA forecasts very little growth in wind power but considerable growth in solar power capacity as solar PV costs continue to decline.
- Average Electricity Prices Stay Low: Average electricity prices are anticipated to grow from 10.6 to 11.0 cents per kilowatt-hour between 2017 and 2050, a remarkably low 4% increase over 33 years.
- Energy-Related Carbon Dioxide Emissions: Under the current suite of policies, EIA forecasts that energy-related carbon dioxide emissions decline thru the mid-2030s and then gradually rise to, in 2050, about the level they were at in 2017—essentially a wash.
Again, for more discussion and some graphical representations of these issues, take a look at our longer analysis.