Mark Twain reportedly observed in 1919 that "A falsehood can travel around the world and back again while the truth is lacing up its boots." When it comes to the debate surrounding Environmental Protection Agency (EPA) recent rules, Twain’s quip still rings true.
Take, for example, EPA’s Affordable Clean Energy (ACE) proposed rule on power sector carbon dioxide emissions slated to replace the Obama Administration’s Clean Power Plan (CPP). Issued in 2015, the CPP final rule raised a host of legal concerns, including that it swept away decades of agency precedent and dramatically stretched the EPA’s authority under the Clean Air Act beyond recognition. The Supreme Court also weighed in and, in an unprecedented move, suspended the CPP more than two and a half years ago, a clear sign of its legal vulnerability. We have long supported EPA’s efforts to produce a new proposal that addresses emissions without exceeding the statutory limits of the Clean Air Act. ACE does this and is superior to CPP in many ways, as we have detailed elsewhere.
Seriously flawed claims about this replacement plan, however, have taken on a life of their own, making it difficult to distinguish fact from fiction. In fact, faulty claims about ACE have appeared in the pages of multiple major publications and been repeated by elected officials and advocacy groups.
Let’s start with the assertions made about ACE in the Washington Post last August. It reported the plan, “. . . is projected to release at least 12 times the amount of carbon dioxide into the atmosphere compared with the Obama rule over the next decade . . . By 2030, according to administration officials, the proposal would cut CO2 emissions from 2005 levels by between 0.7 percent and 1.5 percent, compared with a business-as-usual approach [emphasis added].” There was no attribution for either statement.
In late November, the New York Times weighed in with a similar story. It said, “. . . the Trump administration’s replacement unveiled in August, known as the Affordable Clean Energy rule, sets no national benchmark. It aims to cut carbon dioxide emissions from 2005 levels by 0.7 to 1.5 percent by 2030. According to estimates by [unnamed] environmental groups, that means the amount of carbon dioxide emitted from American power plants over the next decade could be up to 12 times higher than it would have been under the Obama-era plan [i.e., CPP].”
These claims have proliferated farther and wider than Twain could have imagined. The “12-times” allegation especially has been picked up and uncritically repeated as fact in Fortune, CNBC, Yahoo News, Slate, Clean Technica, Yale University, in material from advocacy groups (such as here, here, here, and here), at EPA’s public hearing on the ACE proposal, and even in a letter from 23 U.S. Senators. Some of these sources cite the August Post story, while others link to an (original) August 21st story in Britain’s Guardian (which removed the “12 times higher” statement in an updated story). Not surprisingly, the claims also have generated a lot of buzz on Twitter.
As dire as these reported claims sound, there’s nothing to substantiate them.
Let’s start with the claim that under ACE, carbon dioxide emissions would fall 0.7% to 1.5% “from 2005 levels” by 2030. Carbon dioxide emissions from the power sector in 2005 were 2,416 million metric tons (MMT). The EPA’s Regulatory Impact Assessment (RIA) for the proposed rule examines three different scenarios, and these indicate that with ACE in place, power sector emissions reach between 1,619 MMTCO2 and 1,631 MMTCO2 in 2030. These figures translate into 32% to 33% below the 2005 level, far more than the alleged 0.7% to 1.5%. In fact, for this allegation to be true, the expectation would be that power sector emissions under ACE would rise about 37% from 2017 to 2030. What EPA actually said was that ACE would lower emissions between 0.7% to 1.5% below the projected baseline trend out to 2030, something entirely different.
The second claim, of unknown provenance, is that total power plant emissions over the next decade could be 12 times higher under ACE than under CPP. Again, the facts don’t substantiate this.
In percentage terms, 12 times higher equates to 1,100% higher. So to accept this claim, one would have to believe that power plant emissions with the ACE rule in place would be 1,100% higher than they would be with the CPP rule in place—not remotely credible. EPA’s analysis suggests the difference is more like 2%.
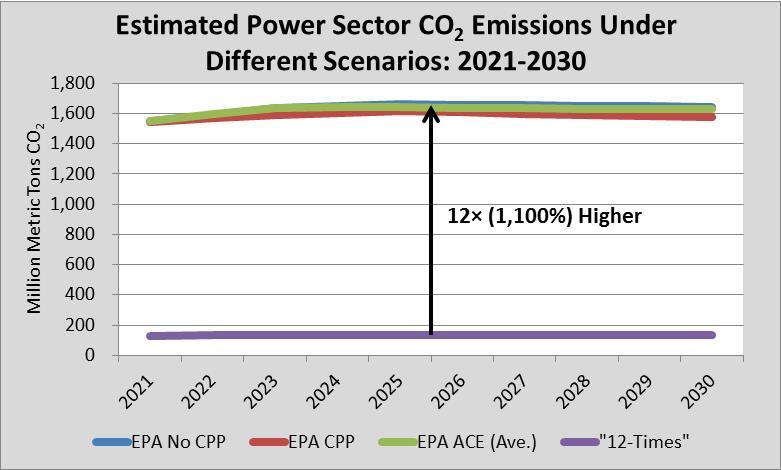
Here’s what a “12 times higher” scenario might look like. EPA’s proposed rule includes emissions projections for ACE for 2021, 2023, 2025, and 2030. Using these figures, we estimate total emissions of about 16.2 gigatons of total emissions for each of the three ACE scenarios for the decade from 2021 to 2030. That averages out to 1,620 MMTCO2 a year, about 33% percent below the 2005 level.
To achieve 12 times less than that 16.2 gigatons, emissions would need to be limited to 1.4 gigatons, an average of 135 MMTCO2 per year or about 94% below the 2005 level over the 10-year period. That’s not a decline to 94% below 2005’s level by 2030, but an average of 94% below over the decade. (See the chart nearby.) We’re not aware of anyone suggesting CPP would result in emission cuts of consistently greater than 90%. For the record, EPA’s modeling has emissions under CPP averaging 34% below 2005’s level from 2021 to 2030.
No matter how you approach the question, the idea that power sector emissions under ACE will be 12 times higher than they would be under CPP is—and we’re being generous here—ridiculous.
Sadly, this episode is not unusual, so we’ll continue to keep our boots laced up to ensure that the facts remain in the race.
UPDATE 12/21/18:
At the time we wrote the blog above, we weren’t sure of the origins of these extravagant claims, especially the “12 times” assertion. The original Post report didn’t provide any guidance on this point while the Times cited “estimates by environmental groups.” Try as we might, we could find no publicly-available analysis making these assertions about ACE.
So we dug some more and we’re convinced we have cracked the code that explains what’s going on. The explanation is actually buried in a rather odd chart accompanying the Post story and reproduced nearby.

We’ll just concern ourselves with the two “Carbon Dioxide” bars on the left. According to this chart: (1) carbon dioxide “emissions from the U.S. power sector in 2030 relative to 2005 levels” under ACE would be just 0.7% to 1.5% lower; and (2) emissions under CPP in 2030 would be about 19% lower. If you divide 19% by 1.5%, you get—voila!—about 12.
From this is made the startling leap that total power plant emissions over the next decade would be 12 times higher under ACE vis-à-vis CPP, something the chart does not show.
We’re confident, however, that what the chart is supposed to show is that the reduction in emissions in 2030—not total emissions reductions as claimed in the text of the article, but the reduction for that year—under CPP would be 12 times greater than the reduction in 2030 under ACE. In other words, the intent of the comparison appears to not be about total power sector emissions under the two rules, but rather the change in emissions in a single year (2030).
That’s certainly a more reasonable interpretation of the data presented in the chart, but that doesn’t make the claim any more accurate.
The issue boils down to this: The “12-times” result appears to be the product of an apples-to-oranges comparison between: (1) emissions projections in the 2018 ACE rule’s regulatory impact analysis, which uses a baseline projection generated in 2018; and (2) emissions projections in the CPP final rule regulatory impact analysis, which uses a baseline projections generated three years earlier in 2015. The 2018 and 2015 baseline projections especially are substantially different. Using different baselines in policy analysis is a huge analytical no-no, and when done renders any comparisons about the competing policies worthless.
Before we explain why, we first have to clear up some things about the bar chart included in the article. It does not show, as labeled, “emissions from the U.S. power sector in 2030 relative to 2005 levels.” It shows emissions in 2030 relative to the 2030 baseline emissions estimate. That’s a big difference, and that’s how we’ve interpreted it.
With that out of the way, let’s begin. EPA’s 2018 ACE regulatory impact analysis includes estimates of: (1) no-CPP baseline emissions; (2) emissions under CPP; and (3) emissions under three different ACE scenarios. The orange bar in the Post’s chart measures for 2030 the percent difference between ACE’s no-CPP baseline emissions estimate for 2030 and emissions with the proposed ACE rule in place. These are the apples.
The grey CPP bar just to the right of it, however, employs a bit analytical sleight-of-hand. It measures the difference in 2030 emissions from a no-CPP baseline against emissions under CPP but using baseline and CPP scenario data from the Obama’s administration’s final CPP rule from 2015. These are the oranges.
The use of 2015-vintage forecast data for the CPP estimate explains how you get the surprising reduction of 19% below the 2030 baseline emissions estimate under CPP. As we’ve shown, when you divide that CPP 19% figure by the ACE 1.5% figure, you get about 12, and that’s how you get the claim the ACE is 12 times worse than CPP.
A simple exercise shows how analytically unsound this is. In the (correctly labeled) chart below, we’ve reproduced just the carbon dioxide data from the originally published chart. We also have added in another “apple” bar showing the percent difference in 2030 between the no-CPP baseline and the CPP emissions estimates from the ACE regulatory impact analysis. It’s the same calculation used to create the gray bar, but it uses the 2018 ACE model runs instead of the 2015 CPP final rule model runs.

Using the “12 times” logic we noted above, if it’s okay to say CPP would deliver about (19% ÷ 1.5% ≈) 12 times the emission reductions of ACE, then it’s also okay to say CPP would deliver (19% ÷ 4% ≈) 4.5 times the emission reductions of . . . CPP. Huh? That’s why comparisons using different baselines are meaningless (unless it’s to compare the baselines!).
If that doesn’t convince you, maybe this will. The table below shows for the years 2025 and 2030: (1) emissions under CPP from the 2015 regulatory impact analysis for the CPP final rule—which is supposed to be 12 times better than ACE—and (2) emissions under the three ACE scenarios from the 2018 regulatory impact analysis for the ACE proposed rule.
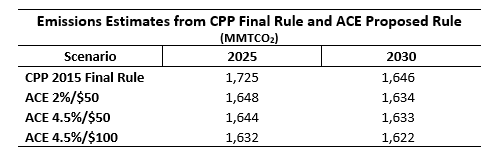
Notice that for all of the ACE scenarios, power sector emissions estimates for 2025 and 2030 are lower than the comparable figures in the CPP regulatory impact analysis from 2015. Someone has to explain how ACE can be 12 times worse than the Obama Administration’s CPP when its estimated emissions are lower. Good luck with that.
No matter how you slice and dice the data, as long as the baseline is consistent, there is no way to justify the claim CPP is 12 times better than ACE. None.